
Navios Maritime Partners L.P. Reports Second Quarter Net Income of $100 Million as Container and Dry Bulk Markets Excel

Navios Maritime Partners L.P., an international owner and operator of dry cargo vessels, reported its financial results for the second quarter and six month period ended June 30, 2021.
Angeliki Frangou, Chairman and Chief Executive Officer of Navios Partners stated, “I am pleased with the results for the second quarter of 2021. During the second quarter, Navios Partners recorded revenue of $152.0 million and net income of $99.9 million.”
Angeliki Frangou continued, “Navios Partners is a top-10 US publicly listed shipping company with a dry cargo fleet of 98 vessels. Of our fleet, 56% are dry bulk vessels and 44% are containerships. This diversified fleet should not only insulate us from normal industry cyclicality, but create optionality as we leverage fundamentals across sectors and reduce cost of capital. Our balance sheet is also strong, with 27.3% net debt to book capitalization and no near term debt maturities.”
Fleet Update
Acquisition of six 5,300 TEU Newbuilding Containerships (four plus two on Navios Partners’ option)
In July 2021, Navios Partners agreed to purchase six 5,300 TEU newbuilding containerships (four plus two optional) for a purchase price of $61.6 million each. The vessels are expected to be delivered into Navios Partners’ fleet during the second half of 2023 and 2024.The closing of the transaction is subject to completion of customary documentation.
Acquisition of one Newbuilding Capesize Vessel
In June 2021, Navios Partners agreed to bareboat charter-in one Japanese newbuilding Capesize vessel from an unrelated third party. The vessel has approximately 180,000 dwt and is being bareboat chartered-in for 10 years. Navios Partners has the option to acquire the vessel starting at the end of year four until the end of the tenth year. The implied acquisition price is approximately $60.0 million and the annual effective interest rate is approximately 4.3%. The vessel is expected to be delivered into Navios Partners’ fleet during the second half of 2022.
Acquisition of one Newbuilding Kamsarmax Vessel
In June 2021, Navios Partners agreed to acquire from an unrelated third party a newbuilding Kamsarmax vessel for a purchase price of $34.3 million. The vessel has approximately 81,000 dwt and is expected to be delivered into Navios Partners’ fleet during the first half of 2023.
Acquisition of three Capesize Vessels
In June 2021, Navios Partners agreed to acquire from Navios Maritime Holdings Inc. (“Navios Holdings”) (NYSE:NM) the Navios Azimuth, a 2011-built Capesize vessel of 179,169 dwt, the Navios Ray, a 2012-built Capesize vessel of 179,515 dwt, and the Navios Bonavis, a 2009-built Capesize vessel of 180,022 dwt for an aggregate purchase price of $88.0 million. The Navios Bonavis and the Navios Ray were delivered into Navios Partners’ fleet in June 2021 and the Navios Azimuth was delivered in July 2021. The acquisition of these vessels was approved by the Conflicts Committee of the Board of Directors of Navios Partners.
Sale of Two Vessels
In July 2021, Navios Partners agreed to sell the Harmony N, a 2006-built Containership of 2,824 TEU, to an unrelated third party for a net sale price of $28.7 million. The sale is expected to be completed during the third quarter of 2021.
In July 2021, Navios Partners agreed to sell the Navios Azalea, a 2005-built Panamax vessel of 74,759 dwt, to an unrelated third party for a net sale price of $12.7 million. The sale is expected to be completed during the third quarter of 2021.
Current Fleet
Following the above transactions, on a fully delivered basis, our fleet would consist of 98 vessels, 55 dry bulk vessels and 43 containerships with a total capacity of 9.3 million dwt.
Financing Update
In March 2021, Navios Partners entered into a new credit facility with a commercial bank for a total amount of $58.0 million in order to refinance two dry bulk vessels and to finance the acquisition of the Navios Avior and the Navios Centaurus. The credit facility has an amortization profile of 8.8 years, matures in March 2026 and bears interest at LIBOR plus 3.0% per annum.
In January and March 2021, Navios Partners entered into bareboat charter-in agreements for four Japanese newbuilding Capesize vessels. The total implied amount financed for the three vessels is approximately $144.0 million and for the fourth is approximately $48.0 million and the implied effective interest rate is 4.4% and 5.0%, respectively.
In April 2021, Navios Partners entered into a new credit facility with a commercial bank for a total amount of $40.0 million in order to refinance the existing facility of two dry bulk vessels and to finance the acquisition of two containerships. The facility has an amortization profile of seven years, matures in the second quarter of 2025 and bears interest at LIBOR plus 2.85% per annum.
In April 2021, Navios Partners entered into a new credit facility with a commercial bank for a total amount of $8.9 million in order to finance the acquisition of one containership. The facility has an amortization profile of approximately seven years, matures in the fourth quarter of 2024 and bears interest at LIBOR plus 3.0% per annum.
In May 2021, Navios Partners entered into a new credit facility with a commercial bank for a total amount of up to $160.0 million in order to: (i) refinance its existing facility maturing in August 2021; (ii) refinance one dry bulk vessel; and (iii) finance the acquisition of one dry bulk vessel. The new facility has an amortization profile of approximately eight years, matures in the second quarter of 2025 and bears interest at LIBOR plus 3.10% per annum.
In June 2021, Navios Partners entered into a new credit facility with a commercial bank for a total amount of up to $43.0 million, in order to refinance the existing credit facilities of six dry bulk vessels. The facility has an amortization profile of approximately eight years, matures in the second quarter of 2026 and bears interest at LIBOR plus 300 bps per annum.
As discussed above, in June 2021, Navios Partners entered into a bareboat charter-in agreement for one Japanese newbuilding Capesize vessel. The implied amount financed for the vessel is approximately $48.0 million and the implied effective interest rate is 4.3%.
In June 2021, Navios Partners completed an $18.5 million sale and leaseback transaction with an unrelated third party, for a 2012-built Capesize vessel. The sale and leaseback transaction has a duration of nine years and an implied fixed interest rate of approximately 5.8%. Navios Partners has the option to buy the vessel at maturity.
In June 2021, Navios Partners completed a $15.0 million sale and leaseback transaction with an unrelated third party, for a 2009-built Capesize vessel. The sale and leaseback transaction has a duration of six years and an implied fixed interest rate of approximately 6.1%. Navios Partners has the option to buy the vessel at maturity.
In July 2021, Navios Partners agreed to enter into a $15.0 million sale and leaseback transaction with an unrelated third party, for a 2009-built Capesize vessel. The sale and leaseback transaction has a duration of six years and an implied fixed interest rate of approximately 6.1%. Navios Partners has the option to buy the vessel at maturity. The transaction remains subject to completion of definitive documentation and is expected to close in the third quarter of 2021. No assurance can be provided that the transaction will be completed in full or in part.
In July 2021, Navios Partners agreed to enter into a new credit facility with a commercial bank for a total amount of up to $18.0 million in order to finance the acquisition of one dry bulk vessel. The new facility will have an amortization profile of seven years and will mature in the third quarter of 2026 and will bear interest at LIBOR plus 2.85% per annum. The facility remains subject to completion of definitive documentation and is expected to close in the third quarter of 2021. No assurance can be provided that the transaction will be completed in full or in part.
Cash Distribution
The Board of Directors of Navios Partners declared a cash distribution for the second quarter of 2021 of $0.05 per unit. The cash distribution is payable on August 12, 2021 to all unitholders of record as of August 9, 2021. The declaration and payment of any further dividends remain subject to the discretion of the Board of Directors and will depend on, among other things, Navios Partners’ cash requirements as measured by market opportunities and restrictions under its credit agreements and other debt obligations and such other factors as the Board of Directors may deem advisable.
Long-Term Cash Flow
Navios Partners has entered into medium to long-term time charter-out agreements for its vessels with a remaining average term of approximately 1.5 years. Navios Partners has currently contracted out 85.8% of its available days for the second half of 2021, 44.0% for 2022 and 25.6% for 2023, including index-linked charters. Excluding index-linked charters, Navios Partners expects to generate revenues of approximately $230.5 million, $349.0 million and $230.7 million, respectively. The average contracted daily charter-out rate for the fleet is $22,919 for the second half of 2021, $30,091 for 2022 and $32,420 for 2023.
Three month periods ended June 30, 2021 and 2020
Time charter and voyage revenues of Navios Partners for the three month period ended June 30, 2021 increased by approximately $105.5 million, or 226.6%, to $152.0 million, as compared to $46.5 million for the same period in 2020. The increase in revenue was mainly attributable to the increase in the size of our fleet and to the increase in Time Charter Equivalent (“TCE”) rate. For the three month period ended June 30, 2021, TCE rate increased by 81.2% to $20,296 per day, as compared to $11,202 per day in the same period in 2020. The available days of the fleet increased by 79.7% to 7,242 days for the three month period ended June 30, 2021, as compared to 4,029 in the same period in 2020.
EBITDA of Navios Partners for the three month period ended June 30, 2020 was affected by items described in the table above. Excluding these items, Adjusted EBITDA increased by approximately $76.1 million to $90.4 million for the three month period ended June 30, 2021, as compared to $14.3 million for the same period in 2020. The increase in Adjusted EBITDA was primarily due to a: (i) $105.5 million increase in time charter and voyage revenues; and (ii) $0.7 million decrease in equity in net loss of affiliate companies recorded in the second quarter of 2020. The above increase was partially mitigated by: (i) a $19.8 million increase in vessel operating expenses, mainly due to the increased fleet; (ii) a $3.9 million increase in time charter voyage expenses; (iii) a $3.3 million increase in general and administrative expenses, mainly due to the increased fleet; (iv) a $2.8 million increase in other expense, net; and (v) an approximately $0.3 million increase in direct vessel expenses (excluding the amortization of deferred drydock, special survey costs and other capitalized items).
Net income of Navios Partners for the three month period ended June 30, 2021 was approximately $99.9 million as compared to $14.6 million net loss for the same period in 2020. Net income for the three month period ended June 30, 2020, was affected by items described in the table above. Excluding these items, adjusted net income for the three month period ended June 30, 2021 amounted to $99.9 million as compared to $7.8 million loss for the three month period ended June 30, 2020. The increase in adjusted net income of approximately $107.8 million was due to: (i) an approximately $76.1 million increase in Adjusted EBITDA; (ii) a $42.0 million income from the amortization of the unfavorable lease terms recorded in the three month period ended June 30, 2021; and (iii) a $0.6 million increase in interest income. The above increase was partially mitigated by: (i) an $8.5 million increase in depreciation and amortization expense; (ii) a $1.4 million increase in amortization for deferred drydock, special survey costs and other capitalized items; and (iii) an approximately $1.0 million increase in interest expense and finance cost.
Six month periods ended June 30, 2021 and 2020
Time charter and voyage revenues of Navios Partners for the six month period ended June 30, 2021 increased by approximately $124.0 million, or 133.3%, to $217.1 million, as compared to $93.0 million for the same period in 2020. The increase in revenue was mainly attributable to the increase in the size of our fleet and to the increase in TCE rate. For the six month period ended June 30, 2021, TCE rate increased by 66.8% to $18,276 per day, as compared to $10,957 per day in the same period in 2020. The available days of the fleet increased by 41.4% to 11,494 days for the six month period ended June 30, 2021, as compared to 8,126 in the same period in 2020.
EBITDA of Navios Partners for the six month period ended June 30, 2021 and 2020 was affected by items described in the table above. Excluding these items, Adjusted EBITDA increased by $90.7 million to $124.1 million for the six month period ended June 30, 2021, as compared to $33.4 million for the same period in 2020. The increase in Adjusted EBITDA was primarily due to an approximate $124.0 million increase in time charter and voyage revenues. The above increase was partially mitigated by a: (i) $20.6 million increase in vessel operating expenses, mainly due to the increased fleet; (ii) $4.1 million increase in general and administrative expenses, mainly due to the increased fleet; (iii) $3.6 million increase in other expense, net; (iv) $3.3 million increase in time charter voyage expenses; (v) $1.0 million equity in net earnings of affiliate companies, recorded in the first half of 2020; (vi) $0.5 million net loss on sale of vessels; and (vii) $0.2 million increase in direct vessel expenses (excluding the amortization of deferred drydock, special survey costs and other capitalized items).
Net income of Navios Partners for the six month period ended June 30, 2021 was approximately $236.6 million as compared to $25.4 million net loss for the same period in 2020. Net income was affected by items described in the table above. Excluding these items, adjusted net income for the six month period ended June 30, 2021 amounted to $111.7 million compared to $11.7 million loss for the six month period ended June 30, 2020. The increase in adjusted net income of approximately $123.4 million was due to a: (i) $90.7 million increase in Adjusted EBITDA; (ii) $42.0 million income from the amortization of the unfavorable lease terms recorded in the six month period ended June 30, 2021; and (iii) $0.5 million increase in interest income. The above increase was partially mitigated by: (i) a $7.9 million increase in depreciation and amortization expense; and (ii) an approximately $1.9 million increase in amortization for deferred drydock, special survey costs and other capitalized items.
View Full Report
SCOR records a strong net income of EUR 380 million in H1 2021
Gross written premiums of EUR 8,441 million in H1 2021, up 9.1% at constant FX compared with H1 2020 (up 3.0% at current FX)
Net income of EUR 380 million in H1 2021
Annualized return on equity of 12.2% in H1 2021, 1,177 bps above the risk-free rate1
Estimated solvency ratio of 245% on June 30, 2021, above the optimal solvency range of 185% – 220% as defined in the “Quantum Leap” strategic plan
SCOR SE’s Board of Directors met on July 27, 2021, under the chairmanship of Denis Kessler, to approve the Group’s H1 2021 financial statements.
The key highlights are:
In H1 2021, SCOR records a strong growth with gross premiums up 9.1%2, strong profitability with a net income of EUR 380 million and a very strong solvency position of 245%, demonstrating its ability to create value and its resilience.
The underlying performance of the business continues to be strong, reflecting the successful recent P&C renewals in 2020 and 2021, on the back of a disciplined (re)insurance market environment, with attractive growth prospects.
In H1 2021, the consequences of the Covid-19 pandemic continue to be proactively managed. The impact of Covid-19 on the Life side stands at EUR 268 million3, of which EUR 222 million comes from the U.S. mortality portfolio. In P&C, the impact stands at EUR 109 million4 in H1 2021, stemming mainly from Property Business Interruption lines.
The conclusion of the settlement agreement with Covéa5 demonstrates the value of SCOR’s in-force Life book and provides strong optionality – with a strengthened solvency position and EUR 860 million6 of cash to be reinvested – enabling greater flexibility to fuel growth.
Gross written premiums of EUR 8,441 million in H1 2021, are up 9.1% at constant exchange rates compared with H1 2020 (up 3.0% at current exchange rates).
SCOR Global P&C gross written premiums are up 14.3% at constant exchange rates compared with H1 2020 (up 7.1% at current exchange rates), benefiting from a strong market environment. The net combined ratio stands at 97.2%, including 9.4% of natural catastrophes and 3.6% of Covid-19 related claims. Normalized for natural catastrophes and excluding Covid-19, the net combined ratio stands at an excellent 91.2%, materially outperforming the “Quantum Leap” assumption.
SCOR Global Life gross written premiums are up 5.2% at constant exchange rates compared with H1 2020 (down 0.1% at current exchange rates). SCOR Global Life delivers a technical margin of 13.1% driven by the Covéa retrocession agreements demonstrating the value of the Group’s Life business, and the reduced impact of Covid-19 mortality.
SCOR Global Investments delivers a return on invested assets of 2.5% in H1 2021 driven notably by EUR 98 million of realized gains.
The Group cost ratio, which stands at 4.4% of gross written premiums, is more favorable than the “Quantum Leap” assumption of ~5.0%.
The Group net income stands at EUR 380 million in H1 2021. The annualized return on equity (ROE) stands at 12.2%, 1,177 bps above the risk-free rate7.
The Group generates high operating cash flows of EUR 531 million in H1 2021. The Group’s total liquidity is very strong, standing at EUR 3.5 billion at June 30, 2021.
The Group shareholders’ equity stands at EUR 6,338 million as at June 30, 2021, following the payment of a dividend of EUR 335 million distributed on July 6, 2021. This results in a book value per share of EUR 33.96, compared to EUR 33.01 as at December 31, 2020.
The Group financial leverage stands at 28.0% as at June 30, 2021, lower by 0.5% points compared to December 31, 2020.
The estimated Group solvency ratio stands at 245% on June 30, 2021. This very strong solvency, above the optimal solvency range of 185% – 220% as defined in the “Quantum Leap” strategic plan, was driven by +27% points positive impact as of January 1, 2021 from the retrocession agreement with Covéa. The solvency ratio’s sensitivity to interest rate changes is reduced by the retrocession agreement. The positive impact from operating capital generation and market movements, was partially offset by model changes and Covid-19 impacts.
Denis Kessler, Non-Executive Chairman of SCOR, comments: “The agreement reached with Covéa marks an important milestone for the Group. It enables SCOR to rebuild a working relationship with this leading insurer. It unlocks the value of SCOR’s Life reinsurance portfolio, while giving the Group additional degrees of freedom to manage its capital and pursue its development. All the conditions are in place to pursue profitable and solvent growth.”
Laurent Rousseau, Chief Executive Officer of SCOR, comments: “In the first six months of 2021, SCOR once again demonstrates the strength of its business model and the relevance of its strategy. The Group continues to expand its franchise, in both Life and P&C, and delivers a robust underlying performance despite natural catastrophes, the on-going Covid-19 pandemic and the low-yield environment. SCOR is very well positioned to capture profitable growth opportunities, in particular in the P&C (re)insurance market where pricing and terms & conditions are increasingly attractive.”
1 Based on a 5-year rolling average of 5-year risk-free rates (44 bps in H1 2021)2 At constant exchange rates3 Net of reduced flu claims in the U.S., net of retrocession and before tax, including IBNR4 Net of retrocession and reinstatement premiums, and before tax5 Please refer to the press releases from June 10, 2021 and July 1, 20216 Of which EUR 840 million received on July 1, 20217 Based on a 5-year rolling average of 5-year risk-free rates (44 bps in H1 2021)
Dynagas LNG Partners LP Reports First Quarter Net Income of $15.0 Million, to Continue Deleveraging
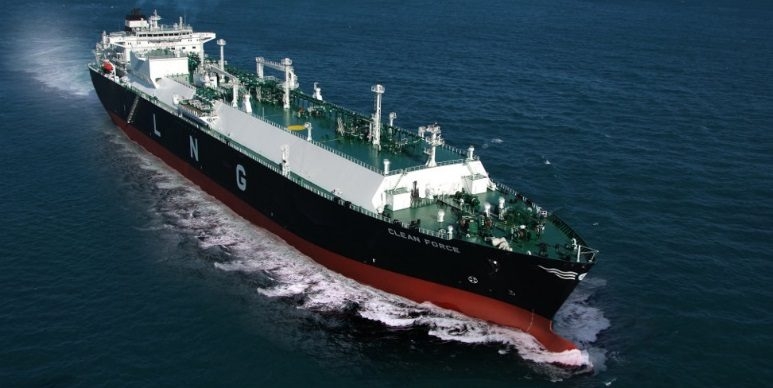
Dynagas LNG Partners LP, an owner and operator of liquefied natural gas (“LNG”) carriers, announced its results for the three months ended March 31, 2021.
Quarter Highlights:
– Net income and earnings per common unit of $15.9 million and $0.36, respectively;
– Adjusted Net Income(1) and Adjusted EBITDA(1) of $10.6 million and $23.9 million, respectively;100% fleet utilization(2);
– Declared and paid cash distribution of $0.5625 per unit on its Series A Preferred Units (NYSE: “DLNG PR A”) for the period from November 12, 2020 to February 11, 2021 and $0.546875 per unit on the Series B Preferred Units (NYSE: “DLNG PR B”) for the period from November 22, 2020 to February 21, 2021; and
– Sold $1.32 million of common units at an average price per unit of $2.9800 pursuant to the Partnership’s Amended & Restated Sales Agreement, which has $28.7 million of remaining availability as of March 31, 2021.
Subsequent Events:
– Declared a quarterly cash distribution of $0.5625 on the Partnership’s Series A Preferred Units for the period from February 12, 2021 to May 11, 2021, which was paid on May 12, 2021;
– Declared a quarterly cash distribution of $0.546875 on the Partnership’s Series B Preferred Units for the period from February 22, 2021 to May 21, 2021, which was paid on May 24, 2021;
– Sold $2.15 million of common units at an average price per unit of $2.8769 pursuant to the Partnership’s Amended & Restated Sales Agreement, which has $26.5 million of remaining availability; andEntered into a new time charter party agreement with Equinor ASA (“Equinor”) for the employment of our LNG carrier Arctic Aurora. Under the new time charter agreement, the Arctic Aurora is expected to be delivered to Equinor in September 2021 in direct continuation of the current charter party with Equinor, meaning there will be no lapse of time between the current and the new time charter. The term ‘in direct continuation’ does not refer to the contracted income.
(1) Adjusted Net Income and Adjusted EBITDA are not recognized measures under U.S. GAAP. Please refer to Appendix B of this press release for the definitions and reconciliation of these measures to the most directly comparable financial measures calculated and presented in accordance with U.S. GAAP and other related information.
(2) Please refer to Appendix B.
CEO Commentary:
We are pleased to report the results for the three months ended March 31, 2021.
All six LNG carriers in our fleet are operating under their respective long-term charters with international gas producers with an average remaining contract term of 7.7 years. As of March 31, 2021, our estimated contracted revenue backlog is approximately $1.12 billion.
After securing a new two year charter for the Arctic Aurora with Equinor, and barring any unforeseen events, the earliest contracted re-delivery date for any of our six LNG carriers is in the third quarter of 2023 (the Arctic Aurora), with the next carrier (the Clean Energy) becoming available for re-chartering in the first quarter of 2026.
For the first quarter of 2021, we reported Net Income of $15.9 million, earnings per common unit of $0.36, Adjusted Net Income of $10.6 million and Adjusted EBITDA of $23.9 million.
Despite the ongoing operational challenges the industry is facing as a result of the COVID-19 outbreak, we are pleased to report 100% utilization for our fleet for the first quarter of 2021.
Going forward, we intend to continue our strategy of using our cash flow generation to deleverage our balance sheet and reinforce our liquidity so as to build equity value over time. This, we believe, will enhance our ability to pursue future growth initiatives.
Three Months Ended March 31, 2021 and 2020 Financial Results
Net Income for the three months ended March 31, 2021 was $15.9 million as compared to a Net Income of $7.0 million for the corresponding period of 2020, which represents an increase of $8.9 million, or 127.1%. The increase in net income for the three months ended March 31, 2021 was mainly attributable to the decrease in finance costs as well as to the increase in gain on our interest rate swap transaction entered into in May 2020 compared to the corresponding period of 2020.
Adjusted Net Income for the three months ended March 31, 2021 was $10.6 million compared to $7.1 million for the corresponding period of 2020, which represents a net increase of $3.5 million or 49.3%, mainly due to decreased finance costs.
Voyage revenues for the three months ended March 31, 2021 were $33.4 million as compared to $34.5 million for the corresponding period of 2020, which represents a decrease of $1.1 million, mainly as a result of the lower variable hire revenues earned on the Lena River in the three months ended March 31, 2021 compared to the corresponding period in 2020.
The Partnership reported average daily hire gross of commissions(1) of approximately $62,250 per day per vessel in the three-month period ended March 31, 2021, compared to approximately $63,100 per day per vessel for the corresponding period of 2020. During the three-month periods ended March 31, 2021 and March 31, 2020, the Partnership’s vessels operated at 100% and 99.0% utilization, respectively.
Vessel operating expenses were $6.9 million, which corresponds to a daily rate per vessel of $12,739 in the three-month period ended March 31, 2021, as compared to $7.6 million, or a daily rate per vessel of $13,872 in the corresponding period of 2020. This decrease is mainly attributable to lower planned engine maintenance on the Lena River during the first quarter of 2021 compared to the first quarter of 2020.
Adjusted EBITDA for the three months ended March 31, 2021 was $23.9 million, as compared to $23.7 million for the corresponding period of 2020. The increase of $0.2 million, or 0.8%, was mainly due to the net effect of the decrease in revenues and decrease in the vessels’ operating expenses as explained above.
Interest and finance costs, net were $5.5 million in the three months ended March 31, 2021 as compared to $8.8 million in the corresponding period of 2020, which represents a decrease of $3.3 million, or 37.5% due to the (i) lower weighted average interest and (ii) the reduction in interest bearing debt as compared to the corresponding period of 2020.
For the three months ended March 31, 2021, the Partnership reported basic and diluted Earnings per common unit and Adjusted Earnings per common unit, of $0.36 and $0.21 respectively, after taking into account the distributions relating to the Series A Preferred Units and the Series B Preferred Units on the Partnership’s Net income/Adjusted Net Income. Earnings per common unit and Adjusted Earnings per common unit, basic and diluted, are calculated on the basis of a weighted average number of 35,735,752 common units outstanding during the period and in the case of Adjusted Earnings per common unit after reflecting the impact of the non-cash items presented in Appendix B of this press release.
Adjusted Net Income, Adjusted EBITDA and Adjusted Earnings per common unit are not recognized measures under U.S. GAAP. Please refer to Appendix B of this press release for the definitions and reconciliation of these measures to the most directly comparable financial measures calculated and presented in accordance with U.S. GAAP.
Amounts relating to variations in period–on–period comparisons shown in this section are derived from the condensed financials presented below.
(1) Average daily hire gross of commissions represents voyage revenue excluding the non-cash time charter deferred revenue amortization, divided by the Available Days in the Partnership’s fleet as described in Appendix B.
Liquidity/ Financing/ Cash Flow Coverage
During the three months ended March 31, 2021, the Partnership generated net cash from operating activities of $22.9 million as compared to $18.7 million in the corresponding period of 2020, which represents an increase of $4.2 million, or 22.5%.
As of March 31, 2021, the Partnership reported total cash of $84.1 million (including $50.0 million of restricted cash). The Partnership’s outstanding indebtedness as of March 31, 2021 under the $675.0 Million Credit Facility amounted to $603.0 million, gross of unamortized deferred loan fees and including $48.0 million, which was repayable within one year.
During the three months ended March 31, 2021, the Partnership sold $1.32 million of common units at an average price per unit of $2.9800 pursuant to the amended and restated ATM Sales Agreement entered into in August 2020, for the offer and sale of common units representing limited partnership interests, having an aggregate offering amount of up to $30.0 million (the “Current ATM Program”). Following these sales, the Current ATM Program has $28.7 million of remaining availability and the Partnership has 36,054,214 units issued and outstanding.
As of March 31, 2021, the Partnership had unused availability of $30.0 million under its interest free $30.0 million revolving credit facility with its Sponsor, or the $30.0 Million Revolving Credit Facility, which was extended on November 14, 2018, and is available to the Partnership at any time until November 2023.
Vessel Employment
As of June 17, 2021, the Partnership had estimated contracted time charter coverage(1) for 100% of its fleet estimated Available Days (as defined in Appendix B) for 2021, 100% of its fleet estimated Available Days for 2022 and 94% of its fleet estimated Available Days for 2023.
As of the same date, the Partnership’s estimated contracted revenue backlog estimate (2) (3) was $1.12 billion, with an average remaining contract term of 7.7 years.
(1) Time charter coverage for the Partnership’s fleet is calculated by dividing the fleet contracted days on the basis of the earliest estimated delivery and redelivery dates prescribed in the Partnership’s current time charter contracts, net of scheduled class survey repairs by the number of expected Available Days during that period.
(2) The Partnership calculates its estimated contracted revenue backlog by multiplying the contractual daily hire rate by the expected number of days committed under the contracts (assuming earliest delivery and redelivery and excluding options to extend), assuming full utilization. The actual amount of revenues earned and the actual periods during which revenues are earned may differ from the amounts and periods disclosed due to, for example, dry-docking and/or special survey downtime, maintenance projects, off-hire downtime and other factors that result in lower revenues than the Partnership’s average contract backlog per day.
(3) $0.15 billion of the revenue backlog estimate relates to the estimated portion of the hire contained in certain time charter contracts with Yamal which represents the operating expenses of the respective vessels and is subject to yearly adjustments on the basis of the actual operating costs incurred within each year. The actual amount of revenues earned in respect of such variable hire rate may therefore differ from the amounts included in the revenue backlog estimate due to the yearly variations in the respective vessels’ operating costs.
Danaos Corporation Reports 74% Increase of First Quarter Net Income, as the Container Market Rallies
Danaos Corporation, one of the world’s largest independent owners of containerships, reported unaudited results for the quarter ended March 31, 2021.
Highlights for the First Quarter Ended March 31, 2021:
– Adjusted net income of $58.0 million, or $2.83 per share, for the three months ended March 31, 2021 compared to $33.3 million, or $1.34 per share, for the three months ended March 31, 2020, an increase of 74.2%.- Operating revenues of $132.1 million for the three months ended March 31, 2021 compared to $106.2 million for the three months ended March 31, 2020, an increase of 24.4%.- Adjusted EBITDA1 of $96.3 million for the three months ended March 31, 2021 compared to $71.9 million for the three months ended March 31, 2020, an increase of 33.9%.- Total contracted operating revenues were $1.2 billion as of March 31, 2021, with charters extending through 2028 and remaining average contracted charter duration of 2.9 years, weighted by aggregate contracted charter hire.- Charter coverage of 91% for the next 12 months based on current operating revenues and 88% in terms of contracted operating days.- Initiated a regular quarterly dividend with a dividend of $0.50 per share of common stock for the first quarter of 2021. The dividend is payable on June 9, 2021 to stockholders of record as of May 27, 2021.
Danaos’ CEO Dr. John Coustas commented:
“The dramatic turnaround and strength of the market which we experienced in the beginning of the year continues unabated, if not stronger. The continuation of the pandemic and the ensuing slowdown in the terminal operations have exacerbated demand and the liner sector is at the limit of its capacity. The blockage of the Suez Canal further contributed to the disruption in the supply chain and conditions will likely not normalize before the end of the year, possibly after the peak season.
Liner companies are reporting record profits and, more importantly, are signing multi-year contracts at significantly higher levels which will keep their profitability at elevated levels. On the non-operating owners front, charter rates have skyrocketed to levels not seen for at least 10 years and what is more important duration has been significantly increased so that vessels over 4,000 TEU can secure 4+ years employment at very healthy levels.
This euphoria due to the sharp increase in rates and confidence that the market will remain strong has led to a dramatic increase in newbuilding ordering. As a result, the orderbook now stands at 17% of the existing fleet which is higher compared to the 9% nadir at the end of 2020 but still much lower than the 50% it reached in 2008.
Fortunately, the lack of shipyard capacity and the hesitance of many market participants to order vessels with conventional fuel propulsion both are inhibiting factors for new orders and are keeping a lid on excessive ordering. In any event, the recently ordered vessels will not deliver until at least 2023, and the next two years should be lean in terms of fleet supply growth. We believe that the expected strong demand growth post pandemic will comfortably absorb the existing orderbook.
As far as Danaos is concerned we are currently in the best ever position and reaping the benefits of the current market environment. On April 12th we completed our refinancing on very competitive terms and also positioned the company successfully in the US bond market, giving us access to a very significant pool of capital. The amortization profile of our debt is resulting in significant free cash flow for growth opportunities.
The stellar performance of the liner sector had a number of significant consequences for us. First, our shareholding in ZIM is today valued at around $400 million. Secondly, the dramatic cash flow generation of Zim and HMM induced them to redeem early the bonds which we were holding so we will have a $75 million cash injection in the second quarter of 2021. Thirdly, the liner sector performance also eliminates counterparty risk for the foreseeable future.
On the chartering front every fixture we concluded was done at a new record level. These fixtures are beginning to take effect and we expect to see improved metrics for every single quarter for this year.
Our strong financial standing and optimistic view for the future has led the Board to decide to reinstate a fixed quarterly dividend of $0.50 per share. Danaos has been repositioned as a growth company and has handsomely rewarded its shareholders through a dramatic share appreciation of greater than 1,000% since our November 2019 equity offering. We believe that our new fixed dividend will both expand our shareholder base to a new group of yield driven institutional investors and also enhance liquidity of the stock.
All the right steps that the company has undertaken in the last couple of years have been greatly appreciated by the market and we will continue along the same path in the future.”
Three months ended March 31, 2021 compared to the three months ended March 31, 2020
During the three months ended March 31, 2021, Danaos had an average of 60.0 containerships compared to 55.7 containerships during the three months ended March 31, 2020. Our fleet utilization for the three months ended March 31, 2021 was 98.6% compared to 91.3% for the three months ended March 31, 2020. Adjusted fleet utilization, excluding the effect of 188 days of incremental off-hire due to shipyard delays related to the COVID-19 pandemic, was 95% in the three months ended March 31, 2020.
Our adjusted net income amounted to $58.0 million, or $2.83 per share, for the three months ended March 31, 2021 compared to $33.3 million, or $1.34 per share, for the three months ended March 31, 2020. We have adjusted our net income in the three months ended March 31, 2021 for the change in fair value of our investment in ZIM of $247.9 million, a non-cash fees amortization and accrued finance fees charge of $5.0 million and stock-based compensation of $4.1 million. Please refer to the Adjusted Net Income reconciliation table, which appears later in this earnings release.
The increase of $24.7 million in adjusted net income for the three months ended March 31, 2021 compared to the three months ended March 31, 2020 is attributable mainly to a $25.9 million increase in operating revenues, a partial collection of common benefit claim of $3.9 million from Hanjin Shipping, a $2.5 million decrease in net finance expenses and a $0.3 million increase in the operating performance of our equity investment in Gemini Shipholdings Corporation (“Gemini”), which were partially offset by a $7.9 million increase in total operating expenses.
On a non-adjusted basis, our net income amounted to $296.8 million, or $14.47 earnings per diluted share, for the three months ended March 31, 2021 compared to net income of $29.1 million, or $1.17 earnings per diluted share, for the three months ended March 31, 2020.
Operating RevenuesOperating revenues increased by 24.4%, or $25.9 million, to $132.1 million in the three months ended March 31, 2021 from $106.2 million in the three months ended March 31, 2020.
Operating revenues for the three months ended March 31, 2021 reflect:
a $10.5 million increase in revenues in the three months ended March 31, 2021 compared to the three months ended March 31, 2020 due to the incremental revenue generated by the newly-acquired vessels; anda $15.4 million increase in revenues in the three months ended March 31, 2021 compared to the three months ended March 31, 2020 mainly as a result of higher charter rates and improved fleet utilization.Vessel Operating ExpensesVessel operating expenses increased by $5.1 million to $31.1 million in the three months ended March 31, 2021 from $26.0 million in the three months ended March 31, 2020, primarily as a result of the increase in the average number of vessels in our fleet and by an increase in the average daily operating cost of $5,954 per vessel per day for vessels on time charter for the three months ended March 31, 2021 compared to $5,522 per vessel per day for the three months ended March 31, 2020. The average daily operating cost increased mainly due to the COVID-19 related increase in crew remuneration in the three months ended March 31, 2021. Management believes that our daily operating cost remains among the most competitive in the industry.
Depreciation & AmortizationDepreciation & Amortization includes Depreciation and Amortization of Deferred Dry-docking and Special Survey Costs.
DepreciationDepreciation expense increased by 4.9%, or $1.2 million, to $25.8 million in the three months ended March 31, 2021 from $24.6 million in the three months ended March 31, 2020 mainly due to the acquisition of five vessels and installation of scrubbers on nine of our vessels in the year ended December 31, 2020.
Amortization of Deferred Dry-docking and Special Survey CostsAmortization of deferred dry-docking and special survey costs increased by $0.2 million to $2.5 million in the three months ended March 31, 2021 from $2.3 million in the three months ended March 31, 2020.
General and Administrative ExpensesGeneral and administrative expenses increased by $5.1 million to $10.9 million in the three months ended March 31, 2021, from $5.8 million in the three months ended March 31, 2020. The increase was mainly due to a $4.6 million increase in stock-based compensation and increased management fees due to the increased size of our fleet.
Other Operating ExpensesOther Operating Expenses include Voyage Expenses.
Voyage ExpensesVoyage expenses increased by $0.2 million to $4.2 million in the three months ended March 31, 2021 from $4.0 million in the three months ended March 31, 2020 primarily as a result of the increase in the average number of vessels in our fleet.
Interest Expense and Interest IncomeInterest expense decreased by 7.4%, or $1.2 million, to $15.1 million in the three months ended March 31, 2021 from $16.3 million in the three months ended March 31, 2020. The decrease in interest expense is attributable to:
(i) a $2.0 million decrease in interest expense due to a decrease in average cost of debt service by approximately 1.5%, which was partially offset by a $70.3 million increase in our average debt (including leaseback obligations), to $1,614.5 million in the three months ended March 31, 2021, compared to $1,544.2 million in the three months ended March 31, 2020; and
(ii) a $0.8 million increase in the amortization of deferred finance costs and debt discount related to our debt.
Our total outstanding debt as of March 31, 2021, reflects an additional amount of $300 million relating to our Senior Notes issued in February 2021, with net proceeds of $294.4 million placed in an escrow account. These net proceeds were used, together with the net proceeds from a new $815 million senior secured credit facility and a new $135 million leaseback arrangement, each drawn in April 2021, to refinance a substantial majority of our outstanding senior secured indebtedness on April 12, 2021. See “Recent Developments”.
As of March 31, 2021, our outstanding debt, net of $294.4 million escrowed net cash proceeds from the Senior Notes and gross of deferred finance costs, was $1,306.8 million and our leaseback obligation was $117.5 million compared to our outstanding debt of $1,396.3 million and our leaseback obligation of $134.3 million as of March 31, 2020.
Interest income increased by $0.3 million to $2.0 million in the three months ended March 31, 2021 compared to $1.7 million in the three months ended March 31, 2020.
Change in fair value of investmentsThe change in fair value of investments of $247.875 million relates to the change in fair value of our shareholding interest in ZIM, which completed its initial public offering and listing on the New York Stock Exchange of its ordinary shares on January 27, 2021. We currently own 10,186,950 ordinary shares of ZIM, which were valued at $247.95 million as of March 31, 2021 compared to the book value of these shares of $75 thousand as of December 31, 2020.
Other finance costs, netOther finance costs, net decreased by $0.2 million to $0.4 million in the three months ended March 31, 2021 compared to $0.6 million in the three months ended March 31, 2020.
Equity income on investmentsEquity income/(loss) on investments increased by $0.3 million to $1.8 million of income on investments in the three months ended March 31, 2021 compared to a $1.5 million income on investments in the three months ended March 31, 2020 due to the improved operating performance of Gemini, in which the Company has a 49% shareholding interest.
Loss on derivativesAmortization of deferred realized losses on interest rate swaps remained stable at $0.9 million in each of the three months ended March 31, 2021 and March 31, 2020.
Other income, netOther income, net was $4.0 million in income in the three months ended March 31, 2021 compared to $0.2 million in the three months ended March 31, 2020. The increase was mainly due to the collection from Hanjin Shipping of $3.9 million as a partial payment of common benefit claim and interest.
Adjusted EBITDAAdjusted EBITDA increased by 33.9%, or $24.4 million, to $96.3 million in the three months ended March 31, 2021 from $71.9 million in the three months ended March 31, 2020. As outlined above, the increase is mainly attributable to a $25.9 million increase in operating revenues, a partial collection of common benefit claim of $3.9 million from Hanjin Shipping and a $0.3 million increase in the operating performance of our equity investees, which were partially offset by a $5.7 million increase in total operating expenses. Adjusted EBITDA for the three months ended March 31, 2021 is adjusted for change in fair value of investments of $247.9 million and stock based compensation of $4.9 million. Tables reconciling Adjusted EBITDA to Net Income can be found at the end of this earnings release.
Dividend Payment
On May 10, 2021 we declared a dividend of $0.50 per share of common stock for the first quarter of 2021, which is payable on June 9, 2021 to stockholders of record as of May 27, 2021. We intend to pay regular quarterly dividends on our common stock. Payments of dividends are subject to the discretion of our board of directors, provisions of Marshall Islands law affecting the payment of distributions to stockholders and the terms of our credit facilities, which permit the payment of dividends so long as there has been no event of default thereunder nor would occur as a result of such dividend payment, and will be subject to conditions in the container shipping industry, our financial performance and us having sufficient available excess cash and distributable reserves.
Recent Developments
On April 12, 2021, the Company refinanced a substantial majority of its outstanding senior secured indebtedness with the proceeds from a $815 million senior secured credit facility with Citibank N.A. and National Westminster Bank plc, a $135 million sale leaseback agreement with Oriental Fleet International Company Limited, an affiliate of COSCO Shipping Lease Co., Ltd., with respect to five vessels, and the net proceeds of the Company’s February 2021 offering of $300 million of 8.500% Senior Notes due 2028.
Swiss Re reports first-quarter net income of USD 333 million, driven by strong underlying performance of all businesses

Excluding COVID-19 claims and reserves, Group net income of USD 843 million and return on equity (ROE) of 12.9%
Property and Casualty Reinsurance (P&C Re) net income of USD 477 million; ROE of 21.6%
Successful April 2021 P&C Re renewals, with growth at attractive margins
Life and Health Reinsurance (L&H Re) net loss of USD 184 million; excluding COVID-19 losses, net income of USD 270 million and ROE of 16.8%
Corporate Solutions net income of USD 96 million; ROE of 16.2%
Strong return on investments (ROI) of 3.5%
Swiss Re reported a Group net income of USD 333 million in the first quarter of 2021, as the strong underlying performance of all businesses more than offset losses related to COVID-19 (USD 643 million) and large natural catastrophes (USD 426 million). Excluding COVID-19-related claims and reserves, Swiss Re’s net income was USD 843 million.
Swiss Re’s Group Chief Executive Officer Christian Mumenthaler said: “The start of 2021 has seen record numbers of COVID-19-related deaths in many countries, and our thoughts go out to those who have lost a loved one. The devastating human toll of the pandemic is also reflected in the financial results of Swiss Re as the world’s largest life and health reinsurer. As we continue to support our clients and communities affected by the pandemic, the underlying performance of all our businesses remains very strong and underpins our confidence.“
Swiss Re’s Group Chief Financial Officer John Dacey said: “The return to profitability this quarter in our property and casualty businesses underlines the earnings potential of our diversified business model. We effectively absorbed the heightened mortality impact on our life and health business and maintained a very strong capital position.“
Swiss Re achieved a strong ROI of 3.5% in the first quarter of 2021. The investment result was driven largely by recurring income supplemented by gains from equity valuations. The result reflected an effective balance of active management and preservation of sustainable income.
P&C Re delivers strong performance, driven by focus on underwriting margins and portfolio quality
P&C Re reported a net income of USD 477 million in the first quarter, up significantly from USD 61 million in the same period last year. This is the result of continued price improvements and disciplined underwriting, which also contained the large natural catastrophe losses of USD 316 million, primarily relating to US winter storms. Excluding COVID-19 impacts, P&C Re’s net income was USD 509 million.
P&C Re’s net premiums earned increased by 5.7% to USD 5.0 billion, driven by strong new business growth in 2020, which continues to earn through in 2021.
The ROE was 21.6% and the combined ratio was 96.5%, despite higher-than-expected natural catastrophe losses as well as COVID-19 impacts. As a result of improving margins, P&C Re is on track to achieve its normalised1 combined ratio estimate of less than 95% in 2021.
Successful April P&C Re renewals
In April 2021, P&C Re renewed treaty contracts with USD 2.6 billion in premium volume. This represents a 20% increase in volume compared with the business that was up for renewal, reflecting attractive transaction opportunities and pricing. P&C Re achieved a nominal price increase of 4% in this renewal round, more than offsetting lower interest rates and higher loss assumptions.
L&H Re achieves strong underlying net income and ROE
L&H Re continued to see significant COVID-19-related losses of USD 570 million, driven by high mortality rates in the US and other countries, and reported a net loss of USD 184 million for the first quarter of 2021.
In the US, the first three months of 2021 saw the highest mortality since the start of the pandemic, with more than 200 000 reported deaths from COVID-19. Since March, the average daily mortality has significantly declined as vaccination efforts progress.
Excluding COVID-19 claims and reserves, L&H Re’s underlying business achieved very strong results, with a net income of USD 270 million and an ROE of 16.8%. This was supported by a strong underwriting performance across all regions and favourable investment results.
Net premiums earned and fee income increased by 13.8% to USD 3.8 billion, primarily driven by longevity transactions in the EMEA region.
Corporate Solutions swings to profit after successful turnaround
For the first quarter of 2021, Corporate Solutions reported a net income of USD 96 million, compared with a net loss of USD 166 million in the prior-year period2, reflecting a continuation of the successful turnaround achieved in 2020 and the diminishing impact of COVID-19-related losses. Excluding the COVID-19-related impacts, net income was USD 112 million.
Net premiums earned remained stable at USD 1.2 billion, as realised rate increases and growth in selected areas offset the impact of previous portfolio pruning measures. The strong pricing momentum experienced in 2020 continued in the first quarter of 2021, with Corporate Solutions achieving risk-adjusted price increases of 13%3.
The ROE amounted to 16.2% and the combined ratio was 96.0%, despite higher-than-expected natural catastrophe losses of USD 110 million. As a result of disciplined underwriting, strict expense management and continued rate increases, the Business Unit is on track to achieve its targeted normalised4 combined ratio of less than 97% in 2021.
Continued dynamic growth at iptiQ
iptiQ continued its strong track record of growth in the first quarter of 2021. Compared with the same period last year, gross premiums written for the core business rose by 150% to USD 167 million, as iptiQ expanded its property and casualty business in the EMEA region.
Outlook
Swiss Re’s Group Chief Executive Officer Christian Mumenthaler said: “We have seen a solid start to 2021 and expect all our businesses to continue delivering a strong underlying performance with diminishing COVID-19 losses. I am particularly encouraged by the improving profitability in our property and casualty businesses, supported by strong renewals year to date in improving market conditions.“
View Full Press Release
TEN Ltd. Reported Net Income of $59.2 Million
TEN, Ltd. (TEN) reports results (unaudited) for the fourth quarter and the year ended December 31, 2020.
FINANCIAL RESULTS FOR THE YEAR 2020
In 2020, TEN earned a net income of $59.2 million before non-cash charges of $35.2 million, compared to $42.7 million net income in 2019 excluding non-cash impairment charge of $27.6 million, a $16.5 million improvement on a year-to-year basis.
Voyage revenues rose to $644.1 million, a $46.7 million increase over 2019, despite the materially reduced global oil demand the pandemic created for most of 2020. In addition, and in view of this lackluster freight environment, TEN advanced nine of its vessels through their obligatory dry-dockings, so as to have them available for healthier charters once the markets rebound. Moreover, the Company is maintaining a significantly higher number of vessels in the spot market, compared to 2019, pending time charter rates to reflect the global economic turnaround a post-Covid-19 environment is expected to create. We are beginning to see signs of that forming in the first quarter and the Company is already taking advantage of that eventuality.
With still many vessels in the fleet operating in attractive time-charters, TEN managed a 94.2% utilization and an average daily TCE per vessel of $23,638 in 2020, an 11% improvement over the previous year. (Total revenues included a significant contribution from the two LNG carriers of $42.1 million.)
TEN achieved operating income of $96.7 million in 2020, compared to $85.9 million in 2019, a 12.6% increase, despite the turbulence the pandemic created to world economies.
Adjusted EBITDA increased to $267 million, $10.0 million higher than in 2019. The Company had a comfortable $172 million cash surplus at year-end after having redeemed all $50 million worth of Series C perpetual preferred stock, in similar fashion with the $50 million Series B perpetual preferred stock redemption a year earlier. A total $100 million preferred shares redemptions, from cash at hand, in a space of about 14 months, in addition to $161 million of scheduled debt repayments in 2020.
Voyage expenses were controlled to $145.3 million in 2020, despite the increased spot vessel activity.
Operating expenses decreased to $179.2 million from the 2019 level, despite a higher number of vessels in operation in 2020. On a daily average per vessel basis, operating expenses were $7,821 per day across our diversified fleet.
Total debt fell by a net $34.8 million despite raising $137 million of new loans, including predelivery financing, at competitive terms, relating to the delivery of our new buildings and our vessels under construction. We also took advantage of low interest rates to refinance loans at considerably better terms, resulting in an extra $43.4 million of cash being made available.
Interest and Finance costs in 2020 were down by $4.1 million from the 2019 level to $70.6 million due to a reduction in spreads and lower margins through various refinancing’s.
FOURTH QUARTER 2020 RESULTS
In the fourth quarter of 2020, the full impact of the economic lockdown was evident in the tanker rates. In view of the above, the Company brought forward the dry-docking of five vessels, originally scheduled for 2021, into the fourth quarter. Despite the weak market, the impact was mitigated by revenues generated by our vessels on fixed-time charter contracts, which allowed the Company to reach revenues of $131.6 million, an EBIDTA of $32.5 million, resulting to a net loss of $11.4 million before non-cash charges.
Total operating costs remained at the same level as the 2019 fourth quarter at $45.7 million, although five of our vessels underwent their scheduled drydocking in the fourth quarter of 2020, compared to only one vessel for the same period of 2019. Daily average operating costs per vessel increased by only $185 per day, due to the valued efforts of our technical managers who had also to adjust to the harsh conditions of the Covid-19 implications, relating to crew safety and repatriation expenses that had become very challenging in today’s environment.
G&A expenses remained the same at $7.2 million, and depreciation and amortization were slightly lower at $34.6 million due to vessels sold in the prior 2020 quarters.
Finance costs were at $9.2 million, down by $4.5 million from the 2019 fourth quarter due to reduced outstanding debt, lower interest rates and positive bunker hedge valuations.
Management remains confident, along with most of our peers, that the tight fundamentals relating to vessel supply, oil demand, oil production and inventories have started to re-align, resulting in stronger rates going forward. In quarter four, the Company successfully completed its four-vessel new building program to a renowned oil major with the delivery of two eco-designed Suezmax vessels, with a maximum of 10 years employment.
Dividend – Common Shares
The Company will pay a dividend of $0.10 per common share in June 2021. Inclusive of this payment, TEN has returned to common shareholders close to $500 million in total dividends since its listing on the NYSE in 2002.
View Full Report
Golden Ocean Reports Fourth Quarter Net Income of $25.4 Million
Golden Ocean Group Limited, a leading dry bulk shipping company, yesterday announced its results for the quarter ended December 31, 2020.
Highlights
▪ Net income of $25.4 million and earnings per share of $0.18 for the fourth quarter of 2020 compared with net income of $39.1 million and earnings per share of $0.27 for the third quarter of 2020.▪ Adjusted EBITDA of $59.3 million for the fourth quarter of 2020, compared with $76.7 million for the third quarter of 2020.▪ Signed the Neptune Declaration on Seafarer Wellbeing and Crew Change.▪ In December 2020, entered into an agreement to sell the Golden Shea, a Panamax vessel, for $9.6 million to an unrelated third party.▪ In January 2021, entered into an agreement to sell the Golden Saguenay, a Panamax vessel, for $8.4 million to an unrelated third party.▪ In February 2021, entered into a Heads of Agreement to acquire 18 modern dry bulk vessels for a total consideration of $752 million.▪ Reported TCE rates for Capesize and Panamax/Ultramax vessels of $18,214 per day and $12,586 per day, respectively, in the fourth quarter of 2020.▪ Estimated TCE rates for the first quarter of 2021, inclusive of charter coverage and calculated on a load-to-discharge basis, are:·approximately $18,200 per day contracted for 66% of the available days for Capesize vessels;·approximately $13,800 per day contracted for 86% of the available days for Panamax vessels
We expect the spot TCEs for the full first quarter of 2021 to be lower than the TCEs currently contracted, due to the impact of ballast days at the end of the first quarter of 2021 as well as current weaker rates.
Ulrik Andersen, Chief Executive Officer, commented:
“The Company continued to deliver a strong performance in the fourth quarter of 2020, despite volatility in freight rates. Thus far the first quarter in 2021 has been the strongest in recent years, which suggests a tight supply and demand balance in the market and bodes well for the balance of the year. We expect positive impacts from seasonality as well as a broader rebound in freight demand as the pandemic softens its grip on the global economy.
Our recently-announced acquisition of 18 large, modern dry bulk vessels significantly increases our exposure to positive market dynamics while also reducing cash break even levels across our fleet. With a best-in-class fleet focused exclusively on large vessel classes, limited capital expenditure commitments and no debt maturities until 2023, Golden Ocean is very well positioned to generate significant cash flow and create value for our shareholders.”
View Full Report
Euroseas Ltd. Reports Net Income of $3.5 Million
Euroseas Ltd., an owner and operator of container carrier vessels and provider of seaborne transportation for containerized cargoes, announced its results for the three and nine-month period ended September 30, 2020.
Third Quarter 2020 Highlights:
Total net revenues of $12.3 million. Net income of $0.2 million; net income attributable to common shareholders (after a $0.2 million dividend on Series B Preferred Shares) of $0.03 million or $0.01 earnings per share basic and diluted. Adjusted net loss attributable to common shareholders1 for the period was $1.5 million or $0.261 per share basic and diluted.
Adjusted EBITDA1 was $1.2 million.
An average of 16.52 vessels were owned and operated during the third quarter of 2020 earning an average time charter equivalent rate of $8,403 per day.
The Company declared a dividend of $0.2 million on its Series B Preferred Shares as required. The dividend will be paid in-kind by issuing additional Series B Preferred Shares.
On August 3, 2020, the Company issued and sold 200,000 shares of its common stock through its at-the-market offering for net proceeds of approximately $0.7 million.
In September 2020, the Company completed the sale of M/V Ninos for a total of approximately $2.3 million of net proceeds of which $1.0 million was used to repay the outstanding loan of the vessel.
Nine Months 2020 Highlights:
Total net revenues of $41.3 million. Net income of $3.5 million; net income attributable to common shareholders (after a $0.5 million dividend on Series B Preferred Shares) of $2.9 million or $0.52 earnings per share basic and diluted. Adjusted net income attributable to common shareholders1 for the period was $0.9 million or $0.151 per share basic and diluted.
Adjusted EBITDA1 was $9.7 million.
An average of 18.17 vessels were owned and operated during the first nine months of 2020 earning an average time charter equivalent rate of $9,171 per day.Recent developments
In November 2020, the Company completed the sale of M/V EM Athens for a total of approximately $4.9 million of net proceeds of which $3.75 million was used to repay the outstanding loan of the vessel. Also, in November 2020, the Company made a supplementary payment of $125,000 in common shares for each of the four vessels it acquired in November 2019 pursuant to the terms of the purchase agreement. The payment was contingent to certain market indices exceeding an agreed upon level, and as a result, the Company issued a total of approximately 161,000 common shares.
Aristides Pittas, Chairman and CEO of Euroseas commented:
“Over the second and third quarters of this year we disposed four of our vessels, including the three eldest ones in our fleet, while in November we also sold the M/V EM Athens, a vessel that would have faced a significant drydocking expense later this year. After the above sales, our fleet numbers 14 vessels with an average age of 15.5 years. In parallel, since July, the feeder and intermediate containership markets have been getting stronger every week reaching –and for several size vessels exceeding – the highs observed over the last decade. If the present levels of rates are sustained, we expect that our vessels will generate significant cash flow and earnings, especially, when the present legacy charters are replaced with ones reflecting the levels of the market.
We are cautiously optimistic about the charter rate developments over the next year as we believe the potential return to normality after the pandemic could restore containerized trade to pre-pandemic -or, likely, higher- growth rates. Such a development when combined with the very low expected fleet growth, as the orderbook is at its lowest level of, at least, the last two decades, could support the current level of charter rates and even propel them to higher levels. We believe our current fleet is well positioned in terms of type and size of vessels to take full advantage of such developments.”
Tasos Aslidis, Chief Financial Officer of Euroseas commented:
“The results of the third quarter of 2020 reflect the increased net revenues compared to the same period of 2019 as we operated an average of 16.52 vessels, versus 13.5 vessels during the same period last year, partly offset by the slightly lower time charter rates our vessels earned in the third quarter of 2020 compared to the corresponding period of 2019. At the same time, total daily vessel operating expenses, including management fees, general and administrative expenses but excluding drydocking costs, during the third quarter of 2020, averaged $6,759 per vessel per day, as compared to $6,388 for the same period of last year and $6,234 per vessel per day for the first nine months of 2020 as compared to $6,348 per vessel per day for the same period of 2019. The increased operating expenses for the third quarter of 2020 is mainly due to increased crewing costs for our vessels compared to the same period of 2019, resulting from difficulties in crew rotation due to COVID-19 related restrictions. In that respect, we are pleased to report that we have been able to rotate the crews on all of our vessels; the safety and well-being of our crew and the safety of our vessel operations are our first priority.
Adjusted EBITDA during the third quarter of 2020 was $1.2 million versus $1.6 million in the third quarter of last year, and it reached $9.7 million versus $4.1 million for the respective nine-month periods of 2020 and 2019.
As of September 30, 2020, our outstanding debt (excluding the unamortized loan fees) was $75.5 million versus restricted and unrestricted cash of $4.8 million. As of the same date, our scheduled debt repayments over the next 12 months amounted to about $14.7 million excluding the unamortized loan fees).”
Third Quarter 2020 Results:
For the third quarter of 2020, the Company reported total net revenues of $12.3 million representing a 19.7% increase over total net revenues of $10.3 million during the third quarter of 2019 which was the result of the increased average number of vessels operating in the third quarter of 2020, partly offset by the lower time charter rates our vessels earned in the third quarter of 2020 compared to the corresponding period of 2019. The Company reported net income for the period of $0.2 million and net income attributable to common shareholders of $0.03 million, as compared to a net loss of $0.2 million and a net loss attributable to common shareholders of $0.3 million respectively, for the third quarter of 2019. The results for the third quarter of 2020 include a $0.3 million amortization of below market time charters acquired and a $1.3 million of net gain on sale of vessels. Related party management fees for the three months ended September 30, 2020 were $1.4 million compared to $0.9 million for the same period of 2019. The increase is due to the higher average number of vessels operated by the Company in the third quarter of 2020 as compared to the same period of 2019. Depreciation expense for the third quarter of 2020 was $1.6 million as compared to $1.1 million for the same period of 2019 due to the increased number of vessels operated by the Company.
Vessel operating expenses for the same period of 2020 amounted to $8.2 million as compared to $6.3 million for the same period of 2019. The increased amount is mainly due to the higher number of vessels owned and operated in the three months of 2020 compared to the same period of 2019. Additionally, some of our vessels incurred increased crewing costs in the third quarter of 2020 compared to the same period of 2019, resulting from difficulties in crew rotation due to COVID-19 related restrictions.
On average, 16.52 vessels were owned and operated during the third quarter of 2020 earning an average time charter equivalent rate of $8,403 per day compared to 13.5 vessels in the same period of 2019 earning on average $8,554 per day.
Interest and other financing costs for the third quarter of 2020 amounted to $0.9 million compared to $0.8 million for the same period of 2019. This increase is due to the increased amount of debt in the current period compared to the same period of 2019, partly offset by the decreased Libor rates of our bank loans during the period as compared to the same period of last year.
Adjusted EBITDA1 for the third quarter of 2020 was $1.2 million compared to $1.6 million achieved during the third quarter of 2019.
Basic and diluted earnings per share attributable to common shareholders for the third quarter of 2020 was $0.01 calculated on 5,708,610 basic and diluted weighted average number of shares outstanding, compared to basic and diluted loss per share of $0.10 for the third quarter of 2019, calculated on 3,283,551 basic and diluted weighted average number of shares outstanding.
Excluding the effect on the loss attributable to common shareholders for the quarter of the amortization of below market time charters acquired, the net gain on sale of vessels and the unrealized loss on derivative, the adjusted loss attributable to common shareholders for the quarter ended September 30, 2020 would have been $0.26 per share basic and diluted compared to an adjusted loss of $0.15 per share basic and diluted for the quarter ended September 30, 2019. Usually, security analysts do not include the above items in their published estimates of earnings per share.
Nine Months 2020 Results:
For the first nine months of 2020, the Company reported total net revenues of $41.3 million representing a 54.5% increase over total net revenues of $26.7 million during the first nine months of 2019, as a result of the increased average number of vessels combined with the higher time charter rates our vessels earned in the first nine months of 2020 compared to the corresponding period of 2019. The Company reported net income for the period of $3.5 million and net income attributable to common shareholders of $2.9 million, as compared to a net loss of $0.9 million and a net loss attributable to common shareholders of $2.5 million, respectively, for the first nine months of 2019. The results for the first nine months of 2020 include a $1.3 million net gain on sale of vessels, $1.5 million of amortization of below market time charters acquired, a $0.1 loss on write down of vessel held for sale and $0.6 million of unrealized loss on derivative. The results for the first nine months of 2019 include $0.2 million of amortization of below market time charters acquired and $0.04 million of unrealized gain on derivative. Related party management fees for the nine months ended September 30, 2020 were $4.0 million compared to $2.5 million for the same period of 2019. The increase is due to the higher average number of vessels operated by the Company in the first nine months of 2020 as compared to the same period of 2019. Depreciation expense for the first nine months of 2020 was $5.0 million compared to $2.7 million during the same period of 2019.
Vessel operating expenses for the same period of 2020 amounted to $24.7 million as compared to $16.1 million for the same period of 2019. The increased amount is mainly due to the higher number of vessels owned and operated in the nine months of 2020 compared to the same period of 2019.
Drydocking expenses amounted to $0.4 million for the nine months of 2020 (one vessel passed its intermediate survey in-water and two vessels their special survey in-water), compared to $1.2 million for the same period of 2019 where one of our vessels completed her special survey with drydock, another one completed her intermediate survey in-water and one vessel entered into drydock that was completed in the fourth quarter of 2019.
On average, 18.17 vessels were owned and operated during the first nine months of 2020 earning an average time charter equivalent rate of $9,171 per day compared to 11.83 vessels in the same period of 2019 earning on average $8,638 per day.
Interest and other financing costs for the first nine months of 2020 amounted to $3.3 million compared to $2.3 million for the same period of 2019. This increase is due to the increased amount of debt in the current period compared to the same period of 2019, partly offset by the decreased Libor rates of our bank loans during the period as compared to the same period of last year. Adjusted EBITDA1 for the first nine months of 2020 was $9.7 million compared to $4.1 million during the first nine months of 2019.
Basic and diluted earnings per share attributable to common shareholders for the first nine months of 2020 were $0.52, calculated on 5,621,159 basic and diluted weighted average number of shares outstanding compared to basic and diluted loss per share of $1.19 for the first nine months of 2019, calculated on 2,129,233 basic and diluted weighted average number of shares outstanding.
Excluding the effect on the income attributable to common shareholders for the first nine months of 2020 of the unrealized loss on derivative, the net gain on sale of vessels, the loss on write down of vessel held for sale and the amortization of the below market time charters acquired, the adjusted earnings per share attributable to common shareholders for the nine-month period ended September 30, 2020 would have been $0.15, compared to an adjusted loss of $1.30 per share basic and diluted for the same period in 2019. As mentioned above, usually, security analysts do not include the above items in their published estimates of earnings per share.
View Full Report
Quarterly Statement as at 30 September 2020: Hannover Re expects Group net income of more than EUR 800 million for the 2020 financial year
Gross premium up by 12.3% in the first nine months adjusted for exchange rate effect
Shareholders’ equity rises by 2.8% to EUR 10.8 billion
Return on equity reaches 8.3%
Additional reserves for Covid-19 in the third quarter in line with expectations
Group net income of EUR 667.8 million lower than the previous year due to Covid-19 reserves
Group earnings guidance of more than EUR 800 million for 2020
Outlook for 2021: Group net income in the range of EUR 1.15 billion to EUR 1.25 billion
Hannover Re expects Group net income of more than EUR 800 million for the 2020 financial year. The company increased its reserves for Covid-19-related losses in property and casualty reinsurance by EUR 100 million to a total amount of EUR 700 million as at the end of September. In life and health reinsurance the burden from Covid-19 currently stands at EUR 160 million.
“The impacts associated with the Covid-19 pandemic can be better estimated following the close of the third quarter, and we therefore believe that we are now in a position again to provide profit guidance for 2020 and 2021,” Jean-Jacques Henchoz, Chief Executive Officer of Hannover Re, said. “While we feel very comfortable with our 2020 guidance based on our prudent reserving, the outlook for the coming year is dependent on the further course of the pandemic. Movements in reinsurance prices nevertheless give us grounds for optimism.”
Group net income after nine months reaches EUR 667.8 million
The gross written premium for the Group increased by 10.9% as at 30 September 2020 to EUR 19.3 billion (EUR 17.4 billion). Growth would have come in at 12.3% at constant exchange rates. Net premium earned climbed by 9.6% to EUR 15.8 billion (EUR 14.4 billion), equivalent to 11.1% adjusted for exchange rate effects.
The operating profit (EBIT) was down 35.3% from the previous year’s level at EUR 902.9 million (EUR 1,395.4 million). Group net income contracted by 33.4% to EUR 667.8 million (EUR 1,003.2 million). Earnings per share reached EUR 5.54 (EUR 8.32).
The capital adequacy ratio, which measures Hannover Re’s risk-carrying capacity, stood at 222% as at the end of September. This level is comfortably above the internal limit of 180% and the threshold of 200%.
Property and casualty reinsurance:Major loss expenditure exceeds budgeted amount
In property and casualty reinsurance the impacts of the Covid-19 pandemic can now be considerably better estimated – at least as far as the current year is concerned. Furthermore, an increasing and sustained improvement in prices and conditions for insurers and reinsurers alike was evident in the various rounds of renewals held during the year on account of the strains associated with the pandemic, large losses and the low interest rate environment.
Gross written premium in property and casualty reinsurance grew by 14.5% to EUR 13.3 billion (EUR 11.7 billion). At constant exchange rates, the increase would have been 15.9%. Net premium earned climbed by 13.2% to EUR 10.5 billion (EUR 9.3 billion); growth would have reached 14.7% adjusted for exchange rates.
Net major loss expenditure in the first nine months came to EUR 1.1 billion. Of this total amount, EUR 700 million was attributable to Covid-19-related impacts. The largest net losses in the third quarter – aside from the pandemic – included a derecho storm in the United States costing EUR 83.9 million, Hurricane Laura in the US at EUR 64.4 million and the explosion at the Port of Beirut in an amount of EUR 67.4 million.
The combined ratio in property and casualty reinsurance consequently came in at 101.4% (98.6%). Stripping out the loss reserves relating to Covid-19 and making allowance for large loss expenditure in line with expectations, the combined ratio would have amounted to 97.6%.
The operating profit (EBIT) in property and casualty reinsurance declined by 36.0% to EUR 588.5 million (EUR 919.0 million). The contribution made by property and casualty reinsurance to Group net income fell by 34.7% to EUR 418.2 million (EUR 640.1 million).
Life and health reinsurance:Strains from Covid-19 totalling EUR 160 million
In life and health reinsurance the total burden associated with the Covid-19 pandemic as at the end of September came to EUR 160 million, with concrete loss advices amounting to EUR 91 million. The bulk of this was attributable to payments for illnesses and deaths in the United States.
“The increase in the reserves set aside for Covid-19 in life and health reinsurance reflects our conservative reserving policy in response to the global spread of infection,” explained Jean-Jacques Henchoz. “Thanks to the successful remediation of our legacy US mortality book in the previous year, we can be highly satisfied with the performance of the business group despite the sharply increased risk provision.”
Gross written premium in life and health reinsurance rose by 3.6% as at the end of September to EUR 5.9 billion (EUR 5.7 billion); growth would have reached 5.0% adjusted for exchange rate effects. The main driver here was sustained vigorous growth in Asia and Australia. Net premium earned climbed to EUR 5.3 billion (EUR 5.1 billion). Growth of 4.4% would have been recorded at constant exchange rates.
After the previous year’s result in life and health reinsurance had also been significantly boosted by one-time income on the investment side, the operating result (EBIT) retreated by 34.0% as at the end of September to EUR 315.5 million (EUR 477.7 million). The contribution made by life and health reinsurance to Group net income contracted by 26.4% to EUR 296.6 million (EUR 402.9 million).
Investments:Return on investment reaches 2.8%
The portfolio of assets under own management increased to EUR 49.0 billion (31 December 2019: EUR 47.6 billion). Ordinary investment income excluding interest on funds withheld and contract deposits fell by 11.5% to EUR 919.4 million (EUR 1,039.3 million). Altogether, Hannover Re generated investment income of EUR 1,185.0 million (EUR 1,331.9 million). The annualised average return reached 2.8%.
Shareholders’ equity:Shareholders’ equity rises by 2.8% to EUR 10.8 billion
The shareholders’ equity of Hannover Re increased by 2.8% as at 30 September 2020 to EUR 10.8 billion (31 December 2019: EUR 10.5 billion). The book value per share thus reached EUR 89.74 (31 December 2019: EUR 87.30). The annualised return on equity amounted to 8.3% as at 30 September 2020 (31 December 2019: 13.3%).
Guidance 2020:New guidance for Group net income of more than EUR 800 million
Based on available loss estimates for Covid-19, Hannover Re expects Group net income of more than EUR 800 million for the current year. The return on investment should be around 2.7% and gross written premium for the Group should show growth in the high single-digit percentage range adjusted for exchange rate effects.
In recent rounds of renewals held in property and casualty reinsurance Hannover Re was able to benefit from stronger demand for high-quality reinsurance protection at improved prices and conditions. Coming on the back of a protracted soft market phase, this trend reversal is likely to continue both in primary business and on the reinsurance side.
For the renewals as at 1 January 2021 in property and casualty reinsurance Hannover Re therefore expects to book increased premium income and higher prices.
Regarding the dividend for the 2020 financial year, Hannover Re anticipates an ordinary dividend on the previous year’s level of EUR 4.00 per share.Payment of a special dividend is dependent on the business opportunities emerging in the short-term and corresponding capital requirements, especially those arising out of the expected improvements in rates and conditions in the property and casualty reinsurance renewals as at 1 January 2021.
Outlook for 2021:Group net income of EUR 1.15 billion to EUR 1.25 billion
“The Covid-19 pandemic will continue to be a concern for us in the year ahead”, said Jean-Jacques Henchoz. “That said, we already have a clearer picture of the situation now and we feel conservatively enough positioned in our assessment that we can anticipate Group net income in the range of EUR 1.15 billion to EUR 1.25 billion in the coming year. That also puts the good result of 2019 back in reach.”
In addition, Hannover Re expects to generate a return on investment of roughly 2.4% and growth in Group gross premium – adjusted for exchange rate effects – of around 5% in the coming year.
The expectations for 2021 also reflect an increased net major loss budget of EUR 1.1 billion (EUR 975 million). The adjustment is prompted first and foremost by further growth in the underlying business. As usual, all statements regarding future targets are subject to the premise that major loss expenditure remains within the budgeted level and that there are no unforeseen distortions on capital markets.
Hannover Re’s dividend policy remains unchanged for the coming financial year. The company envisages a payout ratio for the ordinary dividend in the range of 35% to 45% of its IFRS Group net income. The ordinary dividend will be supplemented by payment of a special dividend subject to a comfortable level of capitalisation and Group net income in line with expectations.
Increased Voyage Revenues Propel Second Quarter Net Income for Dynagas LNG Partners LP
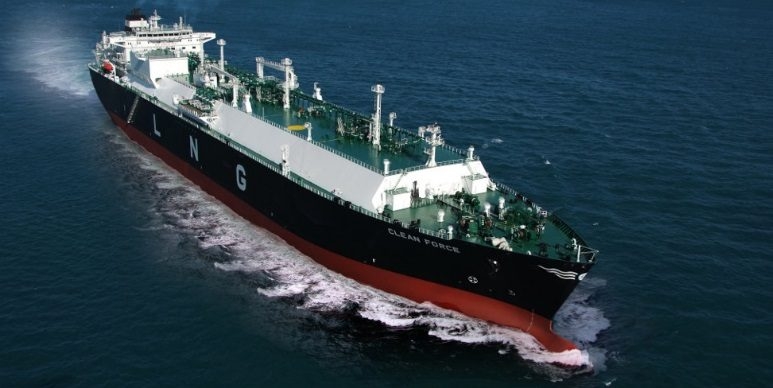
Dynagas LNG Partners LP, an owner and operator of liquefied natural gas (“LNG”) carriers, announced its results for the three and six months ended June 30, 2020.
Quarter Highlights:
Net income of $6.4 million and earnings per common unit of $0.10, after accounting for $3.4 million of non-cash market to market interest rate swap losses;Adjusted Net Income(1) of $9.9 million and Adjusted Earnings per common unit of $0.20 excluding the non-cash mark to market interest rate swap losses;Adjusted EBITDA(1) of $24.1 million;100% fleet utilization;Declared and paid cash distribution of $0.5625 per unit on its Series A Preferred Units (NYSE: “DLNG PR A”) for the period from February 12, 2020 to May 11, 2020 and $0.546875 per unit on the Series B Preferred Units (NYSE: “DLNG PR B”) for the period from February 22, 2020 to May 21, 2020; andEntered into a floating to fixed interest rate swap transaction effective from June 29, 2020 which provides for a fixed 3-month LIBOR rate of 0.41% based on notional values that reflect the amortization schedule of 100% of the Partnership’s debt outstanding under its $675 Million Credit Facility, until the $675 Million Credit Facility matures in September 2024.
Subsequent Events:
Declared a quarterly cash distribution of $0.5625 on the Series A Preferred Units for the period from May 12, 2020 to August 11, 2020, which was paid on August 12, 2020;Declared a quarterly cash distribution of $0.546875 on the Series B Preferred Units for the period from May 22, 2020 to August 21, 2020, which was paid on August 24, 2020; andIn August 2020, the Partnership entered into an amended and restated ATM Sales Agreement (the “A&R Sales Agreement”), for the offer and sale of common units representing limited partnership interests, having an aggregate offering price of up to $30.0 million (the “Current ATM Program”). Upon entry into the A&R Sales Agreement, the Partnership terminated its prior at-the-market program established in July 2020 (the “Prior ATM Program”). At the time of such termination, $0.4 million of the Partnership’s common units out of an aggregate of $30.0 million of its common units were sold pursuant to the Prior ATM Program.(1) Adjusted EBITDA, Adjusted Net Income, and Adjusted Earnings per common unit are not recognized measures under U.S. GAAP. Please refer to Appendix B of this press release for the definitions and reconciliation of these measures to the most directly comparable financial measures calculated and presented in accordance with U.S. GAAP and other related information.
CEO Commentary:
We are pleased to report the results for the three months and six months ended June 30, 2020. All six LNG carriers in our fleet are operating under their respective long-term charters with international gas producers with an average remaining contract term of 8.1 years. The earliest contracted re-delivery date for our six LNG carriers is in the third quarter of 2021 (the Arctic Aurora), with the next carrier (the Clean Energy) becoming available for re-chartering in the first quarter of 2026 at the earliest.
For the second quarter of 2020, we reported Net Income of $6.4 million and Adjusted EBITDA of $24.1 million. This improved performance is attributable to an increase in voyage revenues and a decrease in interest and finance costs compared to the corresponding period in 2019, coupled with stable vessel operating expenses during this period.
Despite the ongoing operational challenges the industry is facing as a result of the COVID-19 outbreak, we are pleased to report 100% utilization for our fleet for the second quarter of 2020. The ongoing impact of the COVID-19 outbreak has been operationally manageable due to our manager’s COVID-19 response plan which has been implemented with the support of our seafarers, charterers and employees, for which we are grateful.
Pursuant to our general objective to manage the cost of debt, we made use of the historically low interest rate environment and entered into a floating to fixed interest rate swap transaction effective from June 29, 2020 until the existing $675.0 Million Credit Facility expires in 2024. The swap provides for a fixed 3-month LIBOR rate of 0.41% and an effective interest rate cost of 3.41% (including margin) applicable for notional amounts matching the full amount and period of our outstanding debt. This was a key development in the execution of our strategic plan as it de-risks our exposure to interest rate volatility while securing a low cost of debt until 2024.
Additionally, in August 2020 we entered into an “at the market” offering program, pursuant to which the Partnership may offer and sell up to $30 million of its common units. Going forward, we intend to continue our strategy of using our cash flow generation to deleverage our balance sheet, reinforce our liquidity and generate cash so as to build equity over time. This, we believe, will enhance our ability to pursue future growth initiatives.
Three Months Ended June 30, 2020 and 2019 Financial Results
Net Income for the three months ended June 30, 2020 was $6.4 million as compared to a Net Income of $0.9 million in the corresponding period of 2019, which represents an increase of $5.5 million, or 611.1%. This increase was mainly attributable to an increase in voyage revenues as well as a decrease in interest and finance costs compared to the corresponding period of 2019. The increase in net income was partially offset by a $3.4 million unrealised loss on the Partnership’s interest rate swap transaction recognised in this quarter (no derivative instruments in the corresponding quarter of 2019) further to the commencement of the Partnership’s interest rate swap transaction effective from June 29, 2020 (see further below).
Adjusted Net Income (which excludes non cash flow items including the above mentioned unrealized loss of $3.4 million on the interest rate swap transaction), for the three months ended June 30, 2020 was $9.9 million compared to $0.8 million in the corresponding period of 2019, representing a net increase of $9.1 million or 1,137.5%.
Voyage revenues for the three months ended June 30, 2020 were $33.9 million as compared to $30.8 million for the corresponding period of 2019, which represents an increase of $3.1 million, mainly as a result of the higher revenues earned on the Lena River following its delivery to its multi-year contract with Yamal Trade Pte (“Yamal”) in July 2019.
The Partnership reported average daily hire gross of commissions(1) of approximately $62,200 per day per vessel in the three-month period ended June 30, 2020, compared to approximately $55,100 per day per vessel in the corresponding period of 2019. During the three-month periods ended June 30, 2020 and 2019, the Partnership’s vessels operated at 100% and 94.4% utilization, respectively.
Vessel operating expenses were $6.9 million in both three-month periods ended June 30, 2020 and 2019, which corresponds to the same daily rate per vessel of $12,630.
Adjusted EBITDA for the three months ended June 30, 2020 was $24.1 million, as compared to $20.9 million for the corresponding period of 2019. The increase of $3.2 million, or 15.3%, was mainly due to the increase in revenues as explained above.
Interest and finance costs, net, were $6.3 million in the three months ended June 30, 2020 as compared to $12.5 million in the corresponding period of 2019, which represents a decrease of $6.2 million, or 49.6% due to the lower weighted average interest and the reduction in the average interest bearing debt as compared to the corresponding period of 2019.
On May 7, 2020, the Partnership entered into a floating to fixed interest rate swap transaction effective from June 29, 2020. It provides a fixed 3-month LIBOR rate of 0.41% based on notional values that reflect the amortization schedule of 100% of the Partnership’s debt outstanding under its $675 Million Credit Facility, until the $675 Million Credit Facility matures in September 2024. The Partnership recognized an unrealised loss on the derivative financial instrument of $3.4 million as of June 30, 2020.
For the three months ended June 30, 2020, the Partnership reported Earnings per common unit and Adjusted Earnings per common unit, basic and diluted, of $0.10 and $0.20 respectively, after taking into account the distributions relating to the Series A Preferred Units and the Series B Preferred Units on the Partnership’s Net income/Adjusted Net Income. Earnings per common unit and Adjusted Earnings per common unit, basic and diluted, are calculated on the basis of a weighted average number of 35,490,000 common units outstanding during the period and in the case of Adjusted Earnings per common unit after reflecting the impact of the non-cash items presented in Appendix B of this press release.
Adjusted Net Income, Adjusted EBITDA and Adjusted Earnings/(Loss) per common unit are not recognized measures under U.S. GAAP. Please refer to Appendix B of this press release for the definitions and reconciliation of these measures to the most directly comparable financial measures calculated and presented in accordance with U.S. GAAP.
Liquidity/ Financing/ Cash Flow Coverage
During the three months ended June 30, 2020, the Partnership generated net cash from operating activities of $8.1 million as compared to $7.0 million in the corresponding period of 2019, which represents an increase of $1.1 million, or 15.7%.
As of June 30, 2020, the Partnership reported total cash of $63.3 million (including $50.0 million of restricted cash). The Partnership’s outstanding indebtedness as of June 30, 2020 under the $675.0 Million Credit Facility amounted to $639.0 million, gross of unamortized deferred loan fees and including $48.0 million, which was repayable within one year.
As of June 30, 2020, the Partnership had unused availability of $30.0 million under its interest free $30.0 million revolving credit facility with its Sponsor, or the $30.0 Million Revolving Credit Facility, which was extended on November 14, 2018, and is available to the Partnership at any time until November 2023.
Vessel Employment
As of September 3, 2020, the Partnership had estimated contracted time charter coverage(1) for 100% of its fleet estimated Available Days (as defined in Appendix B) for 2020, 92% of its fleet estimated Available Days for 2021 and 83% of its fleet estimated Available Days for 2022.
As of the same date, the Partnership’s contracted revenue backlog estimate was $1.18 billion, with an average remaining contract term of 8.1 years.