
Stealthgas Inc. Reports Second Quarter Net Income of $8.9 Million
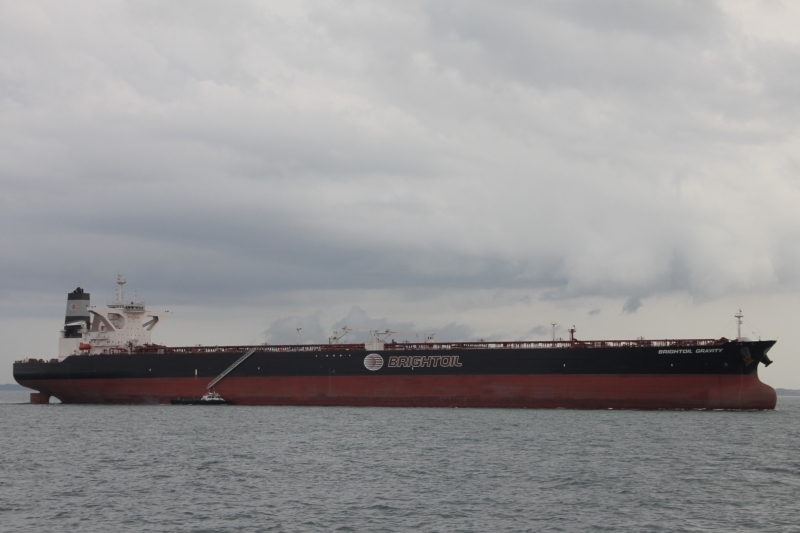
STEALTHGAS INC., a ship-owning company primarily serving the liquefied petroleum gas (LPG) sector of the international shipping industry, announced today its unaudited financial and operating results for the second quarter and six months ended June 30, 2020.
OPERATIONAL AND FINANCIAL HIGHLIGHTS
Fleet utilization of 99.7% in Q2 ’20 – with only 11 days of technical off hire.Fleet operational utilization of 97.1% in Q2 ’20, mainly due to few of our ships being in the spot market – equivalent to 10.8% of voyage days.Fleet calendar days down 6.5% quarter over quarter to 3,743, attributed to our strategic fleet contraction.About 71% of fleet days are secured on period charters for the remainder of 2020, with total fleet employment days for all subsequent periods representing approximately $112 million in contracted revenues. Period coverage for 2021 is currently 32%.Voyage revenues of $36.3 million in Q2 ’20, an increase of $2.2 million compared to Q2 ’19 mostly due to the sharp rise (20%) of revenues stemming from our time charters and reduced presence in the spot market by 48% which were partly offset by the fewer chartered-in vessels.Net Income of $8.9 million for Q2 ’20, corresponding to an EPS of $0.23, our best quarterly performance since the first quarter of 2013.EBITDA of $21.8 million in Q2 ’20, compared to $14.6 million in Q2 ’19.Low gearing, as debt to assets stands at 37.7% and quarter over quarter reduction in finance costs by $1.7 million.Total cash of $51.5 million as of June 30, 2020 – following the cash utilization for the acquisition of two new small LPG vessels from affiliates. The first vessel was delivered in June 2020 while the second vessel will be delivered in September 2020.
Second Quarter 2020 Results
Revenues for the three months ended June 30, 2020 amounted to $36.3 million, an increase of $2.2 million, or 6.5%, compared to revenues of $34.1 million for the three months ended June 30, 2019, following a noticeable rise – 20% – of our time charter revenues stemming mainly from small LPGs and our 22,000 cbm semi-refrigerated vessels, due to higher rates compared to 2019, along with limited exposure in the spot market which was quite soft mostly due to the COVID-19 pandemic.
Voyage expenses and vessels’ operating expenses for the three months ended June 30, 2020 were $2.1 million and $11.6 million respectively, compared to $4.1 million and $11.8 million respectively, for the three months ended June 30, 2019. The $2.0 million decrease in voyage expenses was mainly attributed to a 47.5% quarter-on-quarter reduction of spot days in conjunction with a noticeable decrease in bunker costs. The 1.7% decrease in vessels’ operating expenses compared to the same period of 2019, is a result of the decline of our time charter and spot days, for which we incur operating expenses, by 6.5% compared to the same period of last year.
General and Administrative expenses for the three months ended June 30, 2020 amounted to $0.5 million compared to $0.9 million for the same period of last year. This decrease is mainly attributed to the fact that for the three months ended June 30, 2019 share based compensation expense of $0.2 million was incurred, which was not the case for the three months ended June 30, 2020 since all the shares awarded under our equity compensation plan vested in August 2019.
Depreciation for the three months ended June 30, 2020 was $9.2 million, a $0.3 million decrease from $9.5 million for the same period of last year due to the decrease in the average number of our vessels.Impairment loss for the three months ended June 30, 2020 was $0.7 million relating to two of our oldest vessels. No such loss was recorded in the same period of last year.
Interest and finance costs for the three months ended June 30, 2020 and 2019 were $3.7 million and $5.4 million, respectively. The $1.7 million decrease from the same period of last year is mostly due to the decline of LIBOR rates and the decrease of our indebtedness.Equity income in joint ventures for the three months ended June 30, 2020 and 2019 was $1.9 million and $0.3 million respectively. The $1.6 million increase from the same period of last year, is mainly due to the profitability of the three secondhand (2010 built) 35,000 cbm medium gas carriers which operate under a joint venture arrangement since Q1 ‘20.
As a result of the above, for the three months ended June 30, 2020, the Company reported Net income of $8.9 million, compared to a net loss of $0.2 million for the three months ended June 30, 2019. The weighted average number of shares outstanding for the three months ended June 30, 2020 and 2019 was 38.3 million and 39.8 million, respectively.Earnings per share, basic and diluted, for the three months ended June 30, 2020 amounted to $0.23 compared to loss per share of $0.005 for the same period of last year.
Adjusted net income was $9.5 million or $0.25 earnings per share for the three months ended June 30, 2020 compared to adjusted net income of $0.2 million or $0.01 earnings per share for the same period of last year.EBITDA for the three months ended June 30, 2020 amounted to $21.8 million compared to EBITDA of $14.6 million for the three months ended June 30, 2019. Reconciliations of Adjusted Net Income, EBITDA and Adjusted EBITDA to Net (Loss)/Income are set forth below.An average of 41.1 vessels were owned by the Company during the three months ended June 30, 2020, compared to 42.0 vessels for the same period of 2019.
Six Months 2020 Results
Revenues for the six months ended June 30, 2020, amounted to $70.6 million, a decrease of $1.9 million, or 2.6%, compared to revenues of $72.5 million for the six months ended June 30, 2019, primarily due to the reduction of our calendar days by 9.3% as a result of the decrease in the average number of our vessels by 2.6 vessels, along with fewer charter-in vessels.
Voyage expenses and vessels’ operating expenses for the six months ended June 30, 2020 were $4.9 million and $24.8 million, respectively, compared to $7.9 million and $24.7 million for the six months ended June 30, 2019. The $3.0 million decrease in voyage expenses was mainly due to the 45.7% (or 608 days) reduction of spot days. The $0.1 million increase in vessels’ operating expenses is mostly due to the unforseen technical damage of one vessel which occurred within the first quarter of 2020.Depreciation for the six months ended June 30, 2020, was $18.6 million, a $0.3 million decrease from $18.9 million for the same period of last year, due to the decrease in the average number of our vessels.
Impairment loss for the six months ended June 30, 2020 was $0.7 million relating to two of its oldest vessels. No such loss was recorded in the same period of last year.Interest and finance costs for the six months ended June 30, 2020 and 2019 were $7.9 million and $11.4 million respectively. The $3.5 million decrease from the same period of last year, is mostly due to the decline of LIBOR rates particularly in the second quarter of 2020, along with the decrease of our indebtedness.Equity income in joint ventures for the six months ended June 30, 2020 and 2019 was $2.5 million and $0.5 million respectively. The $2.0 million increase from the same period of last year, is mainly due to the profitability of the three secondhand (2010 built) 35,000 cbm medium gas carriers which operate under a joint venture arrangement since Q1 ‘20.
As a result of the above, the Company reported a net income for the six months ended June 30, 2020 of $11.9 million, compared to a net income of $1.8 million for the six months ended June 30, 2019. The weighted average number of shares outstanding for the six months ended June 30, 2020 and 2019 was 38.9 million and 39.9 million respectively. Earnings per share for the six months ended June 30, 2020 amounted to $0.31 compared to earnings per share of $0.04 for the same period of last year.
Adjusted net income was $12.6 million, or $0.32 per share, for the six months ended June 30, 2020 compared to adjusted net income of $2.3 million, or $0.06 per share, for the same period of last year.
EBITDA for the six months ended June 30, 2020 amounted to $38.3 million compared to EBITDA of $31.7 million for the six months ended June 30, 2019. Reconciliations of Adjusted Net Income, EBITDA and Adjusted EBITDA to Net Income are set forth below. An average of 41.1 vessels were owned by the Company during the six months ended June 30, 2020, compared to 43.7 vessels for the same period of 2019.
As of June 30, 2020, cash and cash equivalents amounted to $36.6 million and total debt amounted to $357.1 million. During the six months ended June 30, 2020 debt repayments amounted to $20.7 million.Fleet Update Since Previous Announcement
The Company announced the conclusion of the following five chartering arrangements:
A one year time charter for its 2018 built 22,000 cbm semi-refrigerated vessel, the Eco Arctic, to an International LPG trader until September 2021.A six months time charter for its 2020 built LPG carrier, the Eco Texiana, to an International LPG Trader until December 2020.A six months time charter for its 2012 built LPG carrier, the Gas Esco, to an International LPG Trader until December 2020.A three months time charter extension for its 2018 built semi-refrigerated vessel, the Eco Freeze, to an International LPG Trader until September 2020.A three months time charter for its 2016 built LPG carrier, the Eco Nical, to an International LPG Trader until September 2020.With these charters, the Company has total contracted revenues of approximately $112 million. Total anticipated voyage days of our fleet is 71% covered for the remainder of 2020 and currently, 32% for 2021.
Including the time charters of our JV arrangements, total contracted revenues amount to $133 million.
Board Chairman Michael Jolliffe Commented
In spite of the global turmoil the COVID-19 pandemic has brought on, StealthGas exerted a very strong performance in the second quarter of 2020 – marking the best quarterly results we have seen over the last seven years. The pillars of our success were principally our strong period coverage secured ahead of the imposed lockdowns, our stable operating cost base and the lowering of our finance costs.
Our conservative strategy of striving to secure our fleet on period charters paid off in that we had concluded several period charters at competitive rates prior to the COVID-19 pandemic outbreak and hence were shielded from any market deterioration while at the same time managed to improve largely upon our profitability.
We proved that we have a strong fleet, solid financial position and efficient strategy, which instills us with confidence in this uncertain market we are facing. Our performance was also a proof against our share price levels, which we deem as an unfair reflection of StealthGas’s dynamics.
Going forward we will strategically navigate the tides of the COVID-19 pandemic, pursuing the best course of action amidst what may prove to be difficult market conditions.
Performance Shipping Inc. Reports Second Quarter Net Income of $4.6 Millon

Performance Shipping Inc., a global shipping company specializing in the ownership of vessels,reported net income and net income attributable to common stockholders of $4.6 million for the second quarter of 2020, compared to a net loss and net loss attributable to common stockholders of $1.6 million for the same period in 2019. Earnings per common share, basic and diluted, for the second quarter of 2020 were $0.09, while loss per share for the second quarter of 2019 was $0.06.
Voyage and time charter revenues were $16.0 million ($11.8 million net of voyage expenses) for the second quarter of 2020, compared to $4.5 million ($4.2 million net of voyage expenses) for the same period in 2019. This increase was mainly attributable to the increased time-charter equivalent rates (TCE rates) contributed by our Aframax tanker vessels. Fleetwide, the average time charter equivalent rate for the second quarter of 2020 was $26,092, compared with an average rate of $11,599 for the same period of 2019. As a result, during the second quarter of 2020, net cash provided by operating activities was $2.9 million, compared with net cash used in operating activities of $0.7 million for the second quarter of 2019.
Net income for the six months ended June 30, 2020 amounted to $5.9 million, compared to a net loss of $1.7 million for the six months ended June 30, 2019. Net income attributable to common stockholders for the six months ended June 30, 2020 amounted to $7.4 million, due to a one-time gain of $1.5 million derived from the repurchase of the Series C preferred shares, and resulted in earnings per common share, basic and diluted, of $0.15. Net loss attributable to common stockholders for the six months ended June 30, 2019 was $1.7 million, resulting in a loss per share of $0.08.
Other Second Quarter 2020 Developments:
Delivery of the containership M/V Rotterdam to her new owners in April 2020Issuance of 600,000 common shares pursuant to conversions of Series B-2 preferred sharesRepurchase and cancellation of all remaining Series B-2 preferred shares in April 2020Repurchase and cancellation of 365,086 common shares under the Share Repurchase ProgramReceipt of NASDAQ notification for extension of the compliance period to cure the bid price deficiency to November 2020
Commenting on the results of the second quarter of 2020, Mr. Andreas Michalopoulos, the Company’s Deputy Chief Executive Officer, stated:
“During the second quarter of 2020, we continued to operate profitably with all four Aframax tankers contributing to our operations. We took advantage of favorable market conditions to secure a time charter contract of minimum seventeen (17) months to maximum nineteen (19) months for our M/T Blue Moon at $28,000 per day. The tanker charter market, as expected, has weakened on the back of lower demand due to COVID-19 and lower supply as OPEC cuts output and a flattening oil price curve. We believe the tanker market will recover during the fall and winter months, and we will be ready to take advantage of that possible recovery should it occur. ”
Novel Coronavirus Risks:
On March 11, 2020, the World Health Organization declared the Novel coronavirus disease (“COVID-19”) outbreak a pandemic. In response to the ongoing outbreak, many countries, ports and organizations, including those where the Company conducts a large part of its operations, have implemented measures to combat the outbreak, such as quarantines, travel restrictions, and physical distancing requirements. Such measures have, and will likely continue to, negatively affect the global economy. Any prolonged restrictive measures in order to control the spread of COVID-19 or other adverse public health developments in Asia or in other geographies in which the Company’s vessels operate may significantly impact the demand for the Company’s vessels. The extent to which COVID-19 will impact the Company’s results of operations and financial condition will depend on future developments, which are highly uncertain and cannot be predicted, including new information which may emerge concerning the severity and duration of the virus and the actions to contain or treat its impact or a potential second wave, among others. Accordingly, an estimate of the impact cannot be made at this time. However, if the COVID-19 pandemic worsens, additional restrictions are imposed, or current restrictions are imposed for a longer period of time in response to the outbreak, it may have a material adverse effect on the Company’s future results of operation and financial condition.
View Full Report
Navios Maritime Acquisition Corporation Reports Second Quarter Net Income of $32.4 Million
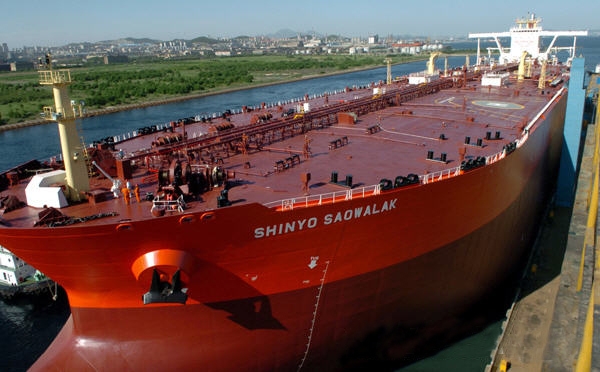
Navios Maritime Acquisition Corporation, an owner and operator of tanker vessels, reported its financial results for the second quarter and six months ended June 30, 2020.
Angeliki Frangou, Chairman and Chief Executive Officer of Navios Acquisition stated, “I am pleased with our results for the second quarter of 2020. During the quarter, Navios Acquisition recorded revenue of $112.2 million, adjusted EBITDA of $72.7 million and adjusted net income of $32.4 million, or $2.03 per share. Our chartering strategy focuses on capturing upside and we earned $20.7 million in profit sharing in the second quarter of 2020. We also declared a quarterly distribution of $0.30 cents per share for the second quarter.”
Angeliki Frangou continued, “During the quarter, we expanded our VLCC fleet by bareboat chartering-in one vessel. We now have bareboat chartered-in four newbuild vessels with in no initial capital outlay. We also successfully liquidated our investment vehicle, Navios Europe II and converted $37.7 million into steel value and cash.
For the second half of 2020, we have 74.0% of our available days fixed (22.1% with profit sharing) at an average charter rate of $19,622 per day estimated to generate $116.2 million of revenue. This contracted rate excludes potential profit sharing. Navios Acquisition has 48.1% of available days with market exposure and a breakeven rate of $14,775 per open /floating day. “
HIGHLIGHTS – RECENT DEVELOPMENTS
Quarterly dividend: $0.30 per share
On July 28, 2020, the Board of Directors declared a quarterly cash dividend in respect of the second quarter of 2020 of $0.30 per share of common stock, which will be paid on October 8, 2020 to stockholders of record as of September 4, 2020. The declaration and payment of any further dividends remain subject to the discretion of the Board of Directors and will depend on, among other things, Navios Acquisition’s cash requirements as measured by market opportunities and restrictions under its credit agreements and other debt obligations and such other factors as the Board of Directors may deem advisable.
Debt developements
In June 2020, Navios Acquisition entered into a loan agreement with a commercial bank of $20.8 million in order to refinance the outstanding balance on the existing facility of two product tankers. The facility is repayable in 16 quarterly installments of $0.8 million each with a final balloon payment of $8.0 million repayable on the last repayment date. The facility matures in June 2024 and bears interest at LIBOR plus 300 bps per annum.
In June 2020, Navios Acquisition entered into sale and leaseback agreements with unrelated third parties for $72.1 million in order to refinance the outstanding balance on the existing facilities of four product tankers. The agreements will be repaid through periods ranging from four to seven years in consecutive quarterly installments of up to $1.8 million each, with a repurchase obligation of up to $27.0 million in total. The sale and leaseback arrangement bears interest at LIBOR plus a margin ranging from 390 bps to 410 bps per annum, depending on the vessel financed.
During the second quarter of 2020, Navios Acquisition prepaid a total of $76.3 million of its existing bank financings.
In the third quarter 2020, Navios Acquisition repurchased $5.0 million of its ship mortgage notes for a cost of $2.9 million.
Liquidation of Navios Europe II Inc.
On June 29, 2020, following the liquidation of Navios Europe II, Navios Acquisition was allocated $8.9 million in cash and seven containerships with their associated working capital. The vessels are accounted for as held for sale. Navios Acquisition drew $41.7 million under a new short term credit facility secured with the seven containerships and repaid $45.1 million of the vessel’s indebtedness.
Continuous Offering Program
On November 29, 2019, Navios Acquisition entered into a Continuous Offering Program Sales Agreement, pursuant to which Navios Acquisition may issue and sell from time to time through the sales agent shares of common stock having an aggregate offering price of up to $25.0 million. As of July 28, 2020, since the commencement of the program, Navios Acquisition has issued 516,250 shares of common stock and received net proceeds of $3.2 million.
Exercised our option for VLCC newbuilding under bareboat charter
In the second quarter of 2020, Navios Acquisition exercised its option for a fourth Japanese newbuild VLCC under a twelve year bareboat charter agreement with de-escalating purchase options and expected delivery in the second quarter of 2022.
The bareboat agreement reflects an implied price of approximately $84.5 million and an annual effective interest of approximately 6% fixed for the duration of the agreement.
Fleet employment
As of July 28, 2020, Navios Acquisition’s core fleet consisted of a total of 47 vessels, of which 14 are very large crude carriers (“VLCCs”) (including four bareboat chartered-in VLCCs expected to be delivered in each of the fourth quarter of 2020, and the first and the third quarters of 2021 and the second quarter of 2022), 31 are product tankers and two are chemical tankers. Navios Acquisition also owns seven containerships that are accounted for as held for sale.
Currently, Navios Acquisition has contracted 85.5% of its available days of its core fleet on a charter-out basis for the remaining six month period of 2020. The average base contractual net daily charter-out rate for the 74.0% of available days that are contracted on base rate and/or base rate with profit sharing arrangements is expected to be $19,622 for the second half of 2020.
Three month periods ended June 30, 2020 and 2019
Revenue for the three month period ended June 30, 2020 increased by $53.6 million, or 91.6%, to $112.2 million, as compared to $58.6 million for the same period of 2019. The increase was mainly attributable to an: (i) increase in revenue by $8.1 million due to the acquisition of five product tankers of Navios Europe I in December 2019; and (ii) increase in market rates during the three month period ended June 30, 2020 as compared to the same period of 2019; partially mitigated by the sale of three VLCCs in 2019. Available days of the fleet increased to 3,859 days for the three month period ended June 30, 2020, as compared to 3,503 days for the three month period ended June 30, 2019, due to the reasons mentioned above. The time charter equivalent rate, or TCE Rate, increased to $28,187 for the three month period ended June 30, 2020, from $15,525 for the three month period ended June 30, 2019.
Time charter and voyage expenses for the three month period ended June 30, 2020 decreased by $0.7 million, or 17.8%, to $3.5 million, as compared to $4.2 million for the same period of 2019. The decrease was mainly attributable to a $1.1 million decrease in bunkers consumption and voyage expenses related to the spot voyages incurred in the period; partially mitigated by a $0.4 million increase in brokers’ commission.
Net income was $31.0 million for the three month period ended June 30, 2020 as compared to $16.6 million net loss for the same period of 2019. Net income was affected by the items described in the table above. Adjusted net income for the three month period ended June 30, 2020 was $32.4 million as compared to $18.6 million adjusted net loss for the same period of 2019. The increase in adjusted net income was mainly attributable to a : (a) $50.6 million increase in adjusted EBITDA; (b) $2.9 million decrease in interest expense and finance cost (excluding write off of deferred finance costs); and (c) $0.7 million decrease in depreciation and amortization; partially mitigated by a : (i) $2.3 million decrease in interest income; and (ii) $1.0 million increase in direct vessel expenses (in relation to amortization of dry dock and special survey cost).
Adjusted EBITDA affected by the items described in the table above, for the three month period ended June 30, 2020 increased by $50.6 million to $72.7 million, as compared to $22.1 million for the same period of 2019. The increase in Adjusted EBITDA was mainly due to a: (a) $53.6 million increase in revenue; (b) $0.7 million decrease in time charter and voyage expenses; (c) $0.4 million decrease in general and administrative expenses (excluding stock-based compensation); and (d) $0.2 million increase in other expense; partially mitigated by a: (i) $3.4 million increase in operating expenses mainly due to the acquisition of the five product tankers of Navios Europe I in December 2019 and to the amendment of the fees under the management agreement, that was also partially impacted by the sale of three VLCCs in 2019; and (ii) $0.9 million decrease in equity in net earnings of affiliated companies.
Six month periods ended June 30, 2020 and 2019
Revenue for the six month period ended June 30, 2020 increased by $74.4 million, or 54.8%, to $210.1 million, as compared to $135.7 million for the same period of 2019. The increase was mainly attributable to an: (i) increase in revenue by $16.9 million due to the acquisition of five product tankers of Navios Europe I in December 2019; and (ii) increase in market rates during the six month period ended June 30, 2020 as compared to the same period of 2019; partially mitigated by the sale of three VLCCs in 2019. Available days of the fleet increased to 7,614 days for the six month period ended June 30, 2020, as compared to 7,187 days for the six month period ended June 30, 2019, due to the reasons mentioned above. The TCE Rate increased to $26,339 for the six month period ended June 30, 2020, from $17,635 for the six month period ended June 30, 2019.
Time charter and voyage expenses for the six month period ended June 30, 2020 increased by $0.5 million, or 6.3%, to $9.5 million, as compared to $9.0 million for the same period of 2019. The increase was mainly attributable to a: (a) $0.4 million increase in brokers’ commission; and (b) a $0.1 million increase in bunkers consumption and voyage expenses related to the spot voyages incurred in the period.
Net income was $31.9 million for the six month period ended June 30, 2020 as compared to $15.7 million net loss for the same period of 2019. Net income was affected by the items described in the table above. Adjusted net income for the six month period ended June 30, 2020 was $47.2 million as compared to $18.0 million adjusted net loss for the same period of 2019. The increase in adjusted net income was mainly attributable to a : (a) $65.6 million increase in adjusted EBITDA; (b) $3.8 million decrease in interest expense and finance cost (excluding write off of deferred finance costs) ; and (c) $1.8 million decrease in depreciation and amortization; partially mitigated by a: (i) $4.4 million decrease in interest income; and (ii) $1.5 million increase in direct vessel expenses (in relation to amortization of dry dock and special survey cost).
Adjusted EBITDA affected by the items described in the table above, for the six month period ended June 30, 2020 increased by $65.6 million to $129.0 million, as compared to $63.4 million for the same period of 2019. The increase in Adjusted EBITDA was mainly due to a: (a) $74.4 million increase in revenue; and (b) $1.5 million decrease in general and administrative expenses (excluding stock-based compensation); partially mitigated by a: (i) $5.3 million increase in operating expenses mainly due to the acquisition of the five product tankers of Navios Europe I in December 2019 and to the amendment of the fees under the management agreement, that was also partially impacted by the sale of three VLCCs in 2019; (ii) $1.7 million decrease in equity in net earnings of affiliated companies; (iii) $1.3 million decrease in other income; (iv) $1.0 million increase in other expense; (v) $0.6 million increase in time charter and voyage expenses; and (vi) $0.4 million increase in direct vessel expenses (other than amortization of dry dock and special survey cost).
View Full Report
SCOR delivers strong results in Q1 2020 with a net income of EUR 162 million
Throughout the past 50 years SCOR has built its reputation on being there for its clients, its employees and all its stakeholders in the most difficult times. The unprecedented crisis we are now facing is no different. On March 11, 2020, the World Health Organization declared the Covid-19 outbreak a global pandemic. The first quarter 2020 results of the SCOR group were not materially affected by the Covid-19 pandemic and the related economic and financial crisis, but this event is ongoing. The impact for the remainder of the financial year cannot be accurately assessed at this stage given the high uncertainty related to the magnitude and duration of the pandemic and of its wide-ranging social, economic and financial consequences on the one hand, and to the possible effects of ongoing and future governmental actions on the other hand. SCOR may see an increased level of claims in its Life and P&C businesses and an increased level of asset impairments during 2020.
As we go through this crisis, we will do everything in our power to support our business partners, employees and local communities throughout the world, while ensuring that our operations continue efficiently.
SCOR is doing its utmost to help stop the spread of the COVID-19 virus, starting within the company. Actively protecting the health of our employees and their loved ones is our top priority. This is why we adopted early and strict prevention measures, before fully activating our Business Continuity Plan and switching to working from home in all Group offices, a move that came before lockdown and social distancing measures were even implemented in most countries. But we are also acting outside the company. SCOR has launched a call to action with the “Spread knowledge, not the virus” campaign, which explains the importance of strict containment measures to combat the pandemic and calls on everyone to contribute to the fight against its spread. The Group is also sharing knowledge on the evolution of Covid-19 with the regular publication of appropriate epidemiological data.
The resilience of SCOR’s operational capability, supported by high-performance IT systems and applications, means that the Group can continue to serve its clients in this period of crisis and immediately respond to their reinsurance needs.
The coronavirus pandemic is being addressed by governments via lockdown policies and fiscal stimulus and by central banks via monetary policies to support financial markets and liquidity concerns. The outcome of these efforts, and notably the timetable at which the spread of the virus subsides, will become clearer over time.
***
SCOR delivers a strong set of results in the first quarter of 2020, combining disciplined growth, strong profitability and robust solvency.
Gross written premiums total EUR 4,158 million in Q1 2020, up 2.2% at constant exchange rates compared with Q1 2019 (up 4.3% at current exchange rates).
SCOR Global P&C gross written premiums are up 2.9% at constant exchange rates compared with Q1 2019 (up 4.8% at current exchange rates). SCOR Global P&C demonstrates solid technical profitability in Q1 2020 with a net combined ratio of 94.5% in line with “Quantum Leap” assumptions.
SCOR Global Life continues to successfully expand its franchise, with gross written premiums up 1.7% at constant exchange rates compared with Q1 2019 (up 4.0% at current exchange rates). SCOR Global Life delivers a strong level of technical profitability in Q1 2020 by recording a technical margin of 7.4%.
SCOR Global Investments pursues a prudent asset management strategy and delivers a strong return on invested assets of 3.1% in Q1 2020, benefiting from capital gains.
The Group cost ratio, which stands at 4.7% of gross written premiums, is better than the “Quantum Leap” assumption of ~5.0%.
The Group net income stands at EUR 162 million for the quarter, up 23.7% compared to Q1 2019. The annualized return on equity (ROE) stands at 10.7%1, 1007 bps above the risk-free rate2, currently exceeding the profitability target of the strategic plan “Quantum Leap”.
Group net operating cash flows stand at EUR 246 million in Q1 2020, with good contributions from both SCOR Global Life and SCOR Global P&C. The Group’s total liquidity is very strong, standing at EUR 2.7 billion at March 31, 2020.
Shareholders’ equity stands at EUR 6,268 million at March 31, 2020, down by EUR 106 million compared with December 31, 2019. This variation is largely explained by the evolution of credit spreads and equity markets in Q1 2020. This results in a strong book value per share of EUR 33.41, compared to EUR 34.06 at December 31, 2019.
Financial leverage stands at 26.6% on March 31, 2020, slightly increasing by 0.2% points compared to December 31, 2019. Allowing for the intended call of the debt3 callable on October 20, 2020, the adjusted financial leverage ratio would be at 25.5%.
The Group’s estimated solvency ratio stands at 210% on March 31, 2020, in the upper part of the optimal solvency range of 185% – 220% as defined in the “Quantum Leap” strategic plan. The reduction in solvency compared to December 31, 2019 was driven by market movements.
SCOR group Q1 2020 key financial details
SCOR’s status on the exposures to the Covid-19 pandemic
SCOR benefits from a strong capital position, high solvency ratio and resilient global franchise. The Group’s current status is the following:
On the Life side, the current situation remains well-below the 1-in-200 year pandemic extreme scenario disclosed by SCOR:
The key exposure relates to mortality business, primarily in the U.S., where SCOR has a diversified portfolio predominantly exposed to younger age and higher socio-economic groups.
There is limited exposure to lines of business impacted by economic downturn, for example disability in France and Australia.
There are some potential positive offsetting impacts over time from our longevity and long-term care (France) portfolios.
On the P&C side, SCOR is continuously monitoring its exposures to the Covid-19 outbreak in light of a rapidly changing environment, considering lines of business (LOBs) according to the degree of materiality of potential impacts:
Many LOBs are simply not loss impacted or have minimal loss exposure even if they may be affected in terms of volume due to the nature of their coverage;
SCOR Global P&C is not involved or has incidental and immaterial exposure in many of the LOBs most affected by the pandemic and the ensuing financial and economic crises, such as event cancellation or contingency business;
The Business Interruption development is being closely monitored, in all relevant jurisdictions;
Potential exposures could also arise within the Trade Credit, Surety and Political Risks portfolio, limited to ~7% of the SCOR Global P&C premium base.
On the investment side, whilst SCOR may in the future see reduced investment income through lower yields and experience higher asset impairments, SCOR entered the Covid-19 crisis with a resilient and defensive investment portfolio:
SCOR has a prudent investment portfolio with limited appetite for asset risks;
Throughout 2019, SCOR voluntarily decreased the risk of the investment portfolio with a material reduction of the credit exposure and a stronger liquidity profile. SCOR’s investment portfolio has a very limited exposure to listed equities (0.6% of invested assets);
At the end of Q1 2020, its fixed income portfolio, of very high quality with an average rating of A+, and highly liquid, has limited exposure to the oil and gas sectors (1.7% of invested assets), as well as to the airlines, retail, leisure, hotel and entertainment sectors (2.4% of invested assets);
The liquidity of the investment portfolio is very strong. The invested assets portfolio (EUR 20.3 billion) benefits from its short duration positioning, with a fixed income duration of 3.2 years (versus 4.3 years at the end of 2018), and with EUR 8.3 billion of financial cash-flows4 expected over the next 24 months, equivalent to 41% of invested assets.
Denis Kessler, Chairman & Chief Executive Officer of SCOR, comments: “The Covid-19 pandemic is a shock of historic severity. It has become a multifaceted crisis which is profoundly impacting the lives of billions of people worldwide. In this context, SCOR has been proactive in taking immediate actions to help stop the spread of the pandemic and to contribute more generally to the wellbeing and resilience of society, for the benefit of all its stakeholders. Our top priority has been to actively protect the health and safety of our employees, to continue operating efficiently and supporting our clients through this disruptive period, to share our knowledge on the evolution of the pandemic and to emphasize the importance of preventative and protective actions to help contain the virus. The current crisis is an ordeal for all of us. The Group is fully mobilized to anticipate, measure and manage the impacts of this major shock, just as it has done for other disasters in the past. We wish each and every one of you the best of health and safety during this very difficult period.”
1 There is uncertainty on the potential negative impacts of the COVID-19 crisis stemming both from claim developments and the capital markets environment. The Q1 figures were not significantly impacted by the crisis and the Q1 financial information may not necessarily be indicative of the interim and full year financial results
2 Based on a 5-year rolling average of 5-year risk-free rates (62 bps in Q1 2020)
3 CHF 125 million undated subordinated note lines, issued on October 20, 2014, and callable in October 2020
4 Investable cash includes current cash balances, and future coupons and redemptions
Swiss Re reports full-year 2019 net income of USD 727 million

– Group net income increased 73% to USD 727 million from USD 421 million in 2018
– Property & Casualty Reinsurance (P&C Re) net income rose 7% to USD 396 million, with net premiums earned up 20%; return on equity (ROE) of 4.4%
– January 2020 P&C Re renewals premium volume up 2% as growth in property business was offset by a reduction in casualty; nominal price increase of 5%
– Life & Health Reinsurance (L&H Re) net income rose 18% to USD 899 million; ROE of 12.4% above target range
– Corporate Solutions net loss of USD 647 million reflects decisive management actions to address underperformance as well as increased claims in US casualty business
– Life Capital result impacted by the previously announced charge related to the agreement to sell ReAssure; net loss of USD 177 million; gross cash generation of USD 1.1 billion
– Excellent return on investments (ROI) of 4.7%; running yield at 2.8%
– Board of Directors to propose a dividend increase of 5% to CHF 5.90 per share and share buyback of up to CHF 1 billion
– Jonathan Isherwood appointed CEO Reinsurance Americas, Regional President and member of the Group Executive Committee, succeeding Eric Smith, who has decided to retire
Swiss Re reported today a 73% increase in Group net income to USD 727 million for 2019. The Group’s property and casualty businesses were impacted by USD 2.7 billion in large losses from natural catastrophes and man-made events, as well as by increased claims in US casualty. Life and health businesses continued to perform strongly, with L&H Re delivering an ROE above its target range. Group net premiums earned and fee income rose 12% to USD 38.6 billion, primarily driven by premium growth in P&C Re. The Group’s ROE improved to 2.5% from 1.4%. Based on the Group’s very strong capital position and supported by confidence in Swiss Re’s long-term capital generation, the Board of Directors will propose to the Annual General Meeting (AGM) an increased dividend of CHF 5.90 per share and authorisation for a public share buyback of up to CHF 1 billion.
Swiss Re Group Chief Executive Officer Christian Mumenthaler said: “Our 2019 results were impacted by heavy natural catastrophe losses, our decisive management actions to reposition Corporate Solutions and increased claims in US casualty. We are taking proactive measures to put us at the forefront of adverse trends. On the other hand, we delivered an excellent investment result and strong performance in L&H Re, demonstrating the power of our diversified business model. We achieved a key strategic milestone with the agreement to sell ReAssure. And we are starting 2020 with an improved quality of our portfolio, underpinned by strong January renewals and pricing momentum.“
Swiss Re continued its strong investment result track record, reporting an ROI of 4.7% for 2019, up from 2.8% in 2018. The improvement was driven by a strong equity market performance, including a significant contribution from the sale of the Group’s investment in the Brazilian insurance group SulAmérica S.A., as well as gains within the fixed income portfolio. The Group’s running yield was largely unchanged at 2.8% compared with 2.9% in the declining global yield environment.
The Group’s capital position remains very strong with a Group Swiss Solvency Test (SST) ratio above the 220% target level. Taking into account the Group’s sustained capital generation, Swiss Re’s Board of Directors will propose a dividend of CHF 5.90 per share for 2019, representing a 5% increase. The dividend will be paid after shareholder approval at the AGM on 17 April 2020. The Board of Directors will also request authorisation from shareholders at the AGM for a public share buyback programme of up to CHF 1 billion purchase value, to be executed at the discretion of the Board and subject to the necessary regulatory approvals.
Swiss Re Group Chief Financial Officer John Dacey said: “Despite significant loss events in 2019, Swiss Re maintains its very strong capital position and continued reserve adequacy. P&C Re matched strong growth with rigorous expense discipline, Corporate Solutions also improved its expense ratio, and L&H Re continues to deliver robust performance. The strength of our business model allows us to continue to offer an attractive dividend bolstered by a public share buyback programme.“
P&C Re profit impacted by large natural catastrophe claims
P&C Re reported a net income for the full year of USD 396 million, up from USD 370 million in 2018. The result reflected large natural catastrophe and man-made losses of USD 2.3 billion as well as proactive measures to address ongoing trends in US casualty. This was balanced by profitable business growth, driven by large transactions and expansion in natural catastrophe business, as well as by a very strong investment result. Net premiums earned increased 20% to USD 19.3 billion. The ROE was 4.4% compared with 3.7% in 2018.
The large natural catastrophe losses in 2019 were driven mainly by typhoons Hagibis and Faxai in Japan, Hurricane Dorian in the Atlantic and wildfires, floods and hailstorms in Australia. The result was further impacted by late claims development from Typhoon Jebi. In addition, man-made losses included the Ethiopian Airlines crash and the subsequent grounding of the Boeing 737 MAX fleet.
The P&C Re combined ratio was 107.8% in 2019, compared with 104.0% reported for 2018. The normalised1 combined ratio was in line with previous estimates and is expected to improve to 97% for 2020.
January P&C Re renewals show healthy growth in natural catastrophe business
Swiss Re renewed contracts with USD 10 billion in premium volume on 1 January 2020. This represents a 2% volume increase compared with 2019 as increases in property business, particularly in the natural catastrophe book, were partly offset by a reduction in casualty lines.
P&C Re achieved a nominal price increase of 5% in this renewal round. Risk-adjusted price quality was unchanged, reflecting lower interest rates and more conservative loss assumptions. Business in many loss-affected regions, such as Japan and Australia, is due to renew later in the year.
L&H Re continues to deliver strong results; ROE above target range
L&H Re reported a strong net income for 2019 of USD 899 million, compared with USD 761 million in 2018. Net premiums earned and fee income increased to USD 13.0 billion from USD 12.8 billion in 2018. Adjusted for unfavourable foreign exchange movements and the termination of an intragroup retrocession agreement with Life Capital, net premiums earned and fee income rose 6.9%.
Return on equity for L&H Re improved to 12.4% from 11.1% in 2018 and was above the business segment’s target range of 10–12%.
The underwriting result included a negative adjustment to the carrying value of an existing treaty, which had to be fair valued following the acquisition of Old Mutual Wealth Life Assurance Limited by ReAssure from Quilter plc, reflecting the decrease in interest rates since treaty inception. As a result, L&H Re rebalanced its asset portfolio, realising gains of a similar magnitude. Excluding this adjustment, the underwriting result was higher than in 2018, driven by active portfolio management and improved mortality developments in the Americas.
Corporate Solutions result impacted by decisive management actions to address underperformance as well as US casualty deterioration
Corporate Solutions reported a net loss of USD 647 million and a combined ratio of 127.9% in 2019, impacted by the decisive management actions announced on 31 July 2019 to reposition the business and strengthen reserves. The result was also affected by large and medium-sized claims, mainly from prior accident years related to the recent deterioration in the US casualty business.
Net premiums earned rose 6.1% to USD 4.2 billion, as double-digit rate increases and growth in targeted lines of business more than offset the impact from active pruning of selected underwriting portfolios.
The Business Unit is making progress in actively managing risk exposure to ensure a more focused and profitable portfolio going forward. The strong pricing momentum experienced in 2019 has continued into early 2020, with Corporate Solutions achieving price increases of 14% in January 2020. The normalised combined ratio for Corporate Solutions is estimated to improve to 105% in 2020, supported by the accelerating momentum in insurance rates and progress in repositioning portfolios. The target normalised combined ratio for 2021 remains at 98%.
Life Capital successfully transitioning to a dynamically growing, digital B2B2C business
Life Capital reported a net loss of USD 177 million for 2019, reflecting a USD 0.2 billion charge related to the agreement to sell ReAssure. Excluding this one-time accounting impact, net income rose to USD 53 million from USD 23 million in 2018.
As announced on 6 December 2019, Swiss Re entered into an agreement to sell ReAssure to Phoenix Group Holdings plc. The transaction, which is expected to close in mid-2020, subject to regulatory and antitrust approvals, valued ReAssure at GBP 3.25 billion and is a significant step for Life Capital in the transformation to a dynamically growing, digital B2B2C business.
Net premiums earned and fee income increased to USD 2.1 billion from USD 1.6 billion in the prior year, driven by growth in the open book businesses and changes to intragroup retrocessions. Gross premiums written of the open books increased by 22% in 2019, when measured at constant foreign exchange rates.Life Capital generated gross cash of USD 1.1 billion in 2019 compared with USD 818 million in the prior year. The gross cash generated in 2019 was mainly driven by proceeds from the sale of subordinated bonds issued by ReAssure and the sale of a 10% stake in ReAssure to MS&AD Insurance Group Holdings Inc, partly offset by the impact of the ReAssure recapitalisation ahead of separation.
Jonathan Isherwood appointed CEO Reinsurance Americas, Regional President and member of the Group Executive Committee
Jonathan Isherwood, who is currently Head of Globals Reinsurance and member of the Reinsurance Executive Committee, will succeed Eric Smith, who has decided to retire. He will take over responsibilities as CEO Reinsurance Americas starting 1 April 2020 and assume the role of Regional President Americas and join the Group Executive Committee effective 14 August 2020. An accomplished leader with close to 30 years of experience in the financial sector, Jonathan Isherwood has held leadership positions across functions such as finance, risk, underwriting, operations and sales. For the past seven years, he successfully led the team working with global clients of the Reinsurance Business Unit. Prior to this role, he led a combined Reinsurance claims department. He also held a variety of positions at GE Insurance Solutions and GE Capital.
Swiss Re’s Chairman Walter B. Kielholz said: “On behalf of the Swiss Re Board of Directors, I would like to thank Eric Smith for his contribution and engagement over the past nine years. His vision, deep market knowledge and client focus helped to advance Swiss Re’s position in the Americas. In Jonathan Isherwood we found an accomplished internal candidate, with a recognised management track-record and a strong client orientation, to take over this important role, and we wish him every success.“
Outlook
Group Chief Executive Officer Christian Mumenthaler said: “Moving into 2020, we remain firmly committed to building resilience for our clients, communities and governments as they face significant and wide-ranging challenges. We will focus on completing the sale of ReAssure and improving the performance of Corporate Solutions through active portfolio pruning and rate increases. We remain confident in our ability to proactively address new industry developments and capture business opportunities while maintaining attractive shareholder returns.“
View Full Report
Costamare Reports Increase of 82% in Fourth Quarter Net Income
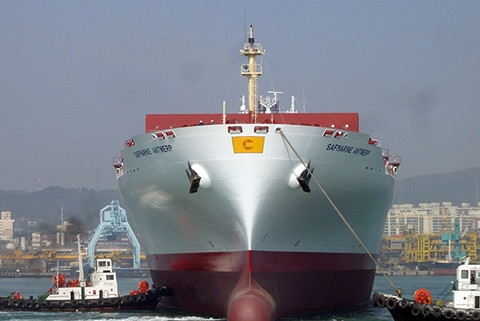
Costamare Inc. reported unaudited financial results for the fourth quarter and year ended December 31, 2019.
Net Income increased by 82% to $35.9 million for the three months ended December 31, 2019 (“Q4 2019”) compared to $19.7 million for the three months ended December 31, 2018 (“Q4 2018”). Earnings per Share available to common stockholders increased by 118% to $0.24 in Q4 2019 compared to $0.11 in Q4 2018.
Adjusted Net Income available to common stockholders(1) increased by 189% to $38.4 million in Q4 2019 compared to $13.3 million in Q4 2018. Adjusted Earnings per Share(1) available to common stockholders increased by 167% to $0.32 in Q4 2019 compared to $0.12 in Q4 2018.
Voyage Revenues increased by 17% to $124.5 million in Q4 2019 compared to $106.2 million in Q4 2018.Continued its fleet renewal. More specifically, the Company:
Acquired the below four containerships:
Vela (2009-built, 4,258 TEU capacity)JPO Virgo (2009-built, 4,258 TEU capacity)Vulpecula (2010-built, 4,258 TEU capacity)Volans (2010-built, 4,258 TEU capacity)
Sold the below four containerships:
Sierra II (1991-built, 2,023 TEU capacity)Namibia II (1991-built, 2,023 TEU capacity)Reunion (1992-built, 2,024 TEU capacity)Neapolis (2000-built, 1,645 TEU capacity) / Sale is expected to be concluded in January 2020
Arranged financing agreements for four 2017-built, 11,010 TEU capacity containerships with leading European and U.S. financial institutions for an aggregate amount of up to $265 million.
Declared dividend of $0.10 per share on its common stock and dividends on all four classes of its preferred stock.
(1) Adjusted Net Income available to common stockholders and Adjusted Earnings per Share are non-GAAP measures and should not be used in isolation or as substitutes for Costamare’s financial results presented in accordance with U.S. generally accepted accounting principles (“GAAP”). For the definition and reconciliation of these measures to the most directly comparable financial measure calculated and presented in accordance with GAAP, please refer to Exhibit I.
New Business Developments
A. Fleet Renewal
Vessel Acquisitions
In December 2019, we acquired three 4,258 TEU capacity sister containerships (2010-built Vulpecula, 2010-built Volans and 2009-built Vela).
In January 2020, we acquired the 2009-built, 4,258 TEU capacity containership JPO Virgo.
We acquired all four vessels using cash in hand and we are currently in advanced discussions with a leading European financial institution for their financing.
II. Vessel Disposals
In October 2019, we sold the 1991-built, 2,023 TEU capacity containership Sierra II.
In November 2019, we sold the 1992-built, 2,024 TEU capacity containership Reunion.
In December 2019, we sold the 1991-built, 2,023 TEU capacity containership Namibia II.
In January 2020, we agreed to sell the 2000-built, 1,645 TEU containership Neapolis. The sale is expected to be concluded by the end of January 2020.
B. New Financing Agreements
We have entered into four separate loan agreements with leading European and U.S. financial institutions for a total amount of up to $265 million. The loan proceeds have been used for the refinancing of the existing indebtedness of four 2017-built, 11,010 TEU containerships (acquired under our JV with York Capital Management) and for general corporate purposes. The new facilities will be repayable over 5 years.
C. Dividend announcements
On January 3, 2020, we declared a dividend for the quarter ended December 31, 2019, of $0.10 per share on our common stock, payable on February 5, 2020, to stockholders of record of common stock as of January 21, 2020.
On January 3, 2020, we declared a dividend of $0.476563 per share on our Series B Preferred Stock, a dividend of $0.531250 per share on our Series C Preferred Stock, a dividend of $0.546875 per share on our Series D Preferred Stock and a dividend of $0.554688 per share on our Series E Preferred Stock, which were all paid on January 15, 2020 to holders of record as of January 14, 2020.
Mr. Gregory Zikos, Chief Financial Officer of Costamare Inc., commented:
“During the fourth quarter and the year, net income and earnings per share increased substantially boosted by higher charter rates and the addition of new ships.
As part of our fleet renewal program, we acquired four panamax vessels with an average age of about 11 years during the quarter and disposed of an equal number of ships with an average age of 27 years.
During the year larger vessels enjoyed a rising charter market and today there is limited supply available in the post -panamax sizes.
We have 18 post -panamax ships coming off charter over the next twelve months, which positions us favorably, should market momentum continue.”
View Full Report
Diana Shipping Inc. Reports Net Income of $1.8 Million
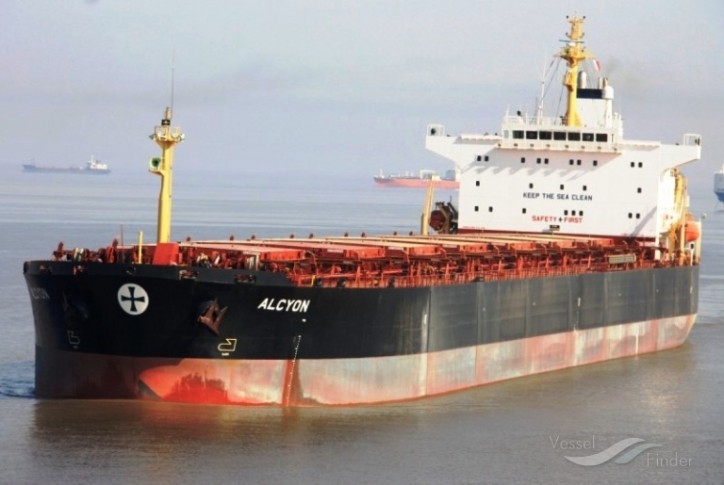
Diana Shipping Inc., a global shipping company specializing in the ownership of dry bulk vessels, yesterday reported net income of $1.8 million and net income attributed to common stockholders of $0.3 million for the third quarter of 2019. This compares to net income of $14.8 million and net income attributed to common stockholders of $13.3 million reported in the third quarter of 2018.
Time charter revenues were $53.5 million for the third quarter of 2019, compared to $61.5 million for the same period of 2018. The decrease in time charter revenues was mainly due to decreased revenues due to the sale of two vessels in December 2018 and five vessels during the nine months ended September 30, 2019 and decreased average time charter rates that the Company achieved for its vessels during the quarter.
Net income for the nine months ended September 30, 2019 amounted to $3.4 million and net loss attributed to common stockholders amounted to $0.9 million, including a $7.5 million impairment loss. This compares to net income and net income attributed to common stockholders of $13.7 million and $9.3 million, respectively, for the same period of 2018. Time charter revenues were $169.2 million for the nine months ended September 30, 2019, compared to $163.3 million for the same period of 2018.
Full Report
Swiss Re reports 23% increase in net income for the first nine months of 2019, supported by growth in Reinsurance
– Group net income of USD 1.3 billion, up from USD 1.1 billion
– Property & Casualty Reinsurance (P&C Re) net income up 39% to USD 880 million; combined ratio of 101.4%; return on equity (ROE) of 11.8%
– Life & Health Reinsurance (L&H Re) delivered strong result with net income of USD 651 million and ROE of 11.8%
– Corporate Solutions net loss of USD 441 million reflects decisive management actions and medium-sized and large man-made and natural catastrophe claims
– Life Capital net income of USD 40 million; gross cash generation of USD 831 million bolstered by exceptional items
– Excellent return on investments (ROI) of 4.3%; stable running yield at 2.9%
– Group Swiss Solvency Test (SST) ratio remains very strong at 241% (1 July 2019 estimate)
Swiss Re reported a Group net income of USD 1.3 billion in the first nine months of 2019, an increase of 23% from USD 1.1 billion for the same period a year earlier, supported by growth in Reinsurance and an excellent investment result. While the Group’s property and casualty businesses were impacted by USD 1.7 billion in large claims from natural catastrophes and man-made events, the life and health businesses continued to deliver a strong performance. Net premiums earned and fee income rose by 10% year-on-year to USD 28.4 billion, driven in particular by growth in P&C Re premiums. The Group’s ROE was 6.0%, and its capital position remained very strong.
Swiss Re’s Group Chief Executive Officer Christian Mumenthaler said: “The strength of our business with its global reach, diversification and very strong capitalisation enabled us to react fast and support our clients and their customers affected by the large natural catastrophes and man-made events in the first nine months. Our Reinsurance Business Unit achieved profitable growth in a challenging market environment. The transformation of Corporate Solutions is underway, and we continue to benefit from robust gross cash generation in Life Capital. Our leading market position and positive rate dynamics year to date give us confidence for the upcoming renewal season.“
Swiss Re reported an ROI of 4.3% in the first nine months of 2019, up from 2.8% in the same period a year earlier. The increase reflects a strong equity market performance, including a significant gain from the sale of the Group’s investment in the Brazilian insurance group SulAmérica S.A., as well as gains within the fixed income portfolio. The Group’s fixed income running yield for the nine-month period remained stable at 2.9%, despite headwinds from the declining yield environment.
Swiss Re maintains a very strong capital position, with a Group SST ratio of 241% (1 July 2019 estimate), exceeding its 220% target. The decline from 251% as of 1 January 2019 reflects capital deployment into profitable growth, expected capital repatriation to shareholders and lower interest rates, partly offset by positive earnings contributions.In light of the capital deployment, significant natural catastrophe losses in 2019, and the decision to suspend the initial public offering of ReAssure, the Board of Directors has decided that the second tranche of the public share buy-back programme will not be launched. The first tranche of the public share buy-back programme of up to CHF 1.0 billion purchase value, which started on 6 May 2019, is well on track, with more than 60% already completed as of 30 September 2019.
Swiss Re’s Group Chief Financial Officer John Dacey said: “The Group’s results in the first nine months underline the strength of our franchise. Despite multiple large natural catastrophe and man-made claims affecting the business, our capital position remains very strong, allowing us to take advantage of growth opportunities in an improving pricing environment.“
P&C Re supported by profitable growth and strong investment performance
P&C Re reported a 39% increase in net income for the first nine months to USD 880 million, supported by profitable business growth and a strong investment performance. Net premiums earned increased 17% to USD 14.2 billion, driven by large transactions and growth in the natural catastrophe business. The ROE improved to 11.8% from 8.3%. The combined ratio was 101.4%. P&C Re continues to be on track to achieve a normalised combined ratio of 98%1 in 2019.
The underwriting performance was impacted by USD 1.1 billion of large claims from natural catastrophes in the current year, including approximately USD 460 million from Typhoon Faxai in Japan and approximately USD 300 million from Hurricane Dorian in the Atlantic. Swiss Re estimates total insured market losses at approximately USD 7 billion for Typhoon Faxai and approximately USD 4.5 billion for Hurricane Dorian. Estimated claims from large man-made events amounted to approximately USD 310 million and included losses stemming from the Ethiopian Airlines crash and the subsequent grounding of the Boeing 737 MAX fleet and the compulsory liquidation of Thomas Cook. The underwriting performance was also impacted by late claims development from Typhoon Jebi in the first quarter, in line with a material increase in the total market loss.
L&H Re continues to deliver strong results
L&H Re delivered stable net income of USD 651 million for the nine months, driven by active portfolio management actions and improved mortality developments in the Americas. The result was also supported by a strong investment performance. ROE was 11.8%, in line with the business segment’s target range. Net premiums earned and fee income remained stable at USD 9.5 billion. This includes the impact of unfavourable foreign-exchange rate movements and the termination of an intragroup retrocession agreement with Life Capital. Adjusted for these two items, net premiums earned increased by 5.6%.
Corporate Solutions results reflect decisive management actions and medium-sized and large man-made and natural catastrophe claims
Corporate Solutions reported a net loss of USD 441 million and a combined ratio of 127.0%. The result was impacted by the decisive management actions to reposition the business as announced on 31 July 2019 as well as medium-sized and large claims. Large man-made and natural catastrophe losses of approximately USD 290 million for the nine-month period include significant claims from Hurricane Dorian and the compulsory liquidation of Thomas Cook in the third quarter.
Net premiums earned increased by 7.6% to USD 3.1 billion, as growth in property and credit lines and rate increases more than offset the impact from active pruning of several underwriting portfolios. Corporate Solutions is making progress in actively reducing risk exposure in specific lines of business to ensure a more focused and profitable portfolio going forward. Swiss Re expects the positive momentum in commercial insurance rates to continue after achieving a broad-based 10% price quality increase in the first nine months of 2019.
Life Capital reports strong closed book performance and dynamic growth in the open book businesses
Life Capital reported net income of USD 40 million in the first nine months of the year, benefitting from strong performance of the closed books, partly offset by expenses from investments in growth of the open book businesses. The exceptional gross cash generation of USD 831 million was bolstered by the sale of subordinated bonds issued by ReAssure and proceeds from the sale of a 10% stake in ReAssure to MS&AD Insurance Group Holding Inc., partially offset by significant unfavourable impacts from market movements and the ReAssure recapitalisation.
Net premiums earned and fee income rose to USD 1.6 billion, driven by growth in the open book businesses and changes to intragroup retrocessions. Gross premiums written of the open books increased 21% year-on-year when measured at constant exchange rates.
Full Report
Aon Q2 2019 net income surges to £224.7m
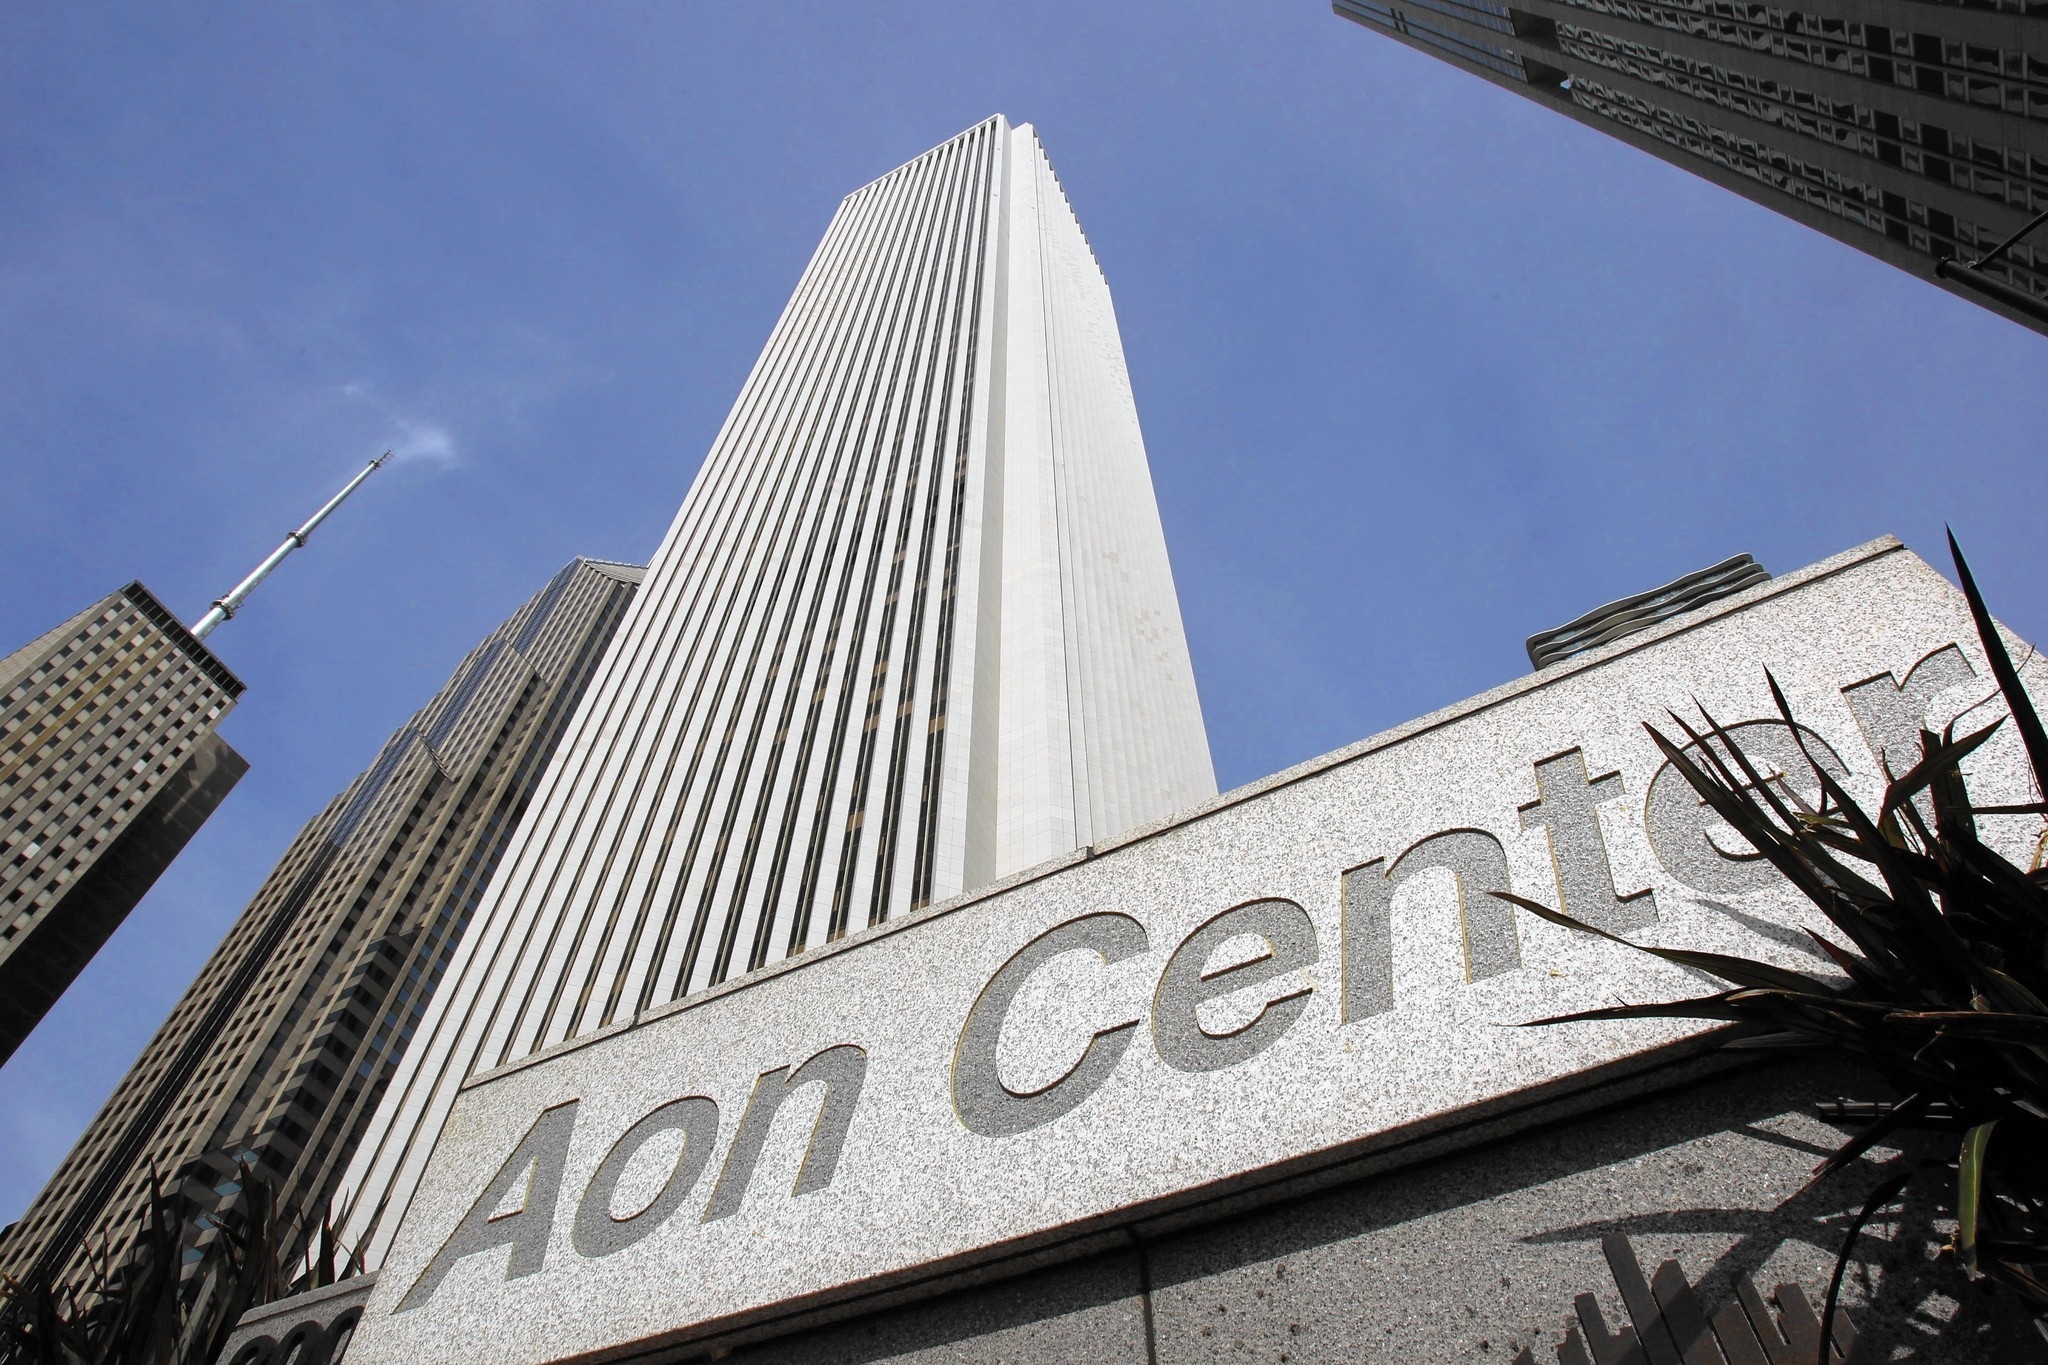
Aon has reported a net income of $277m (£224.7m), or $1.14 (£0.92) per share, for the second quarter of 2019, compared to $47m (£38.13m), or $0.19 (£0.15) per diluted share, for the same period last year.
In the previous quarter, Aon had a net income of $659m (£534.58m), or $2.70 (£2.19) per diluted share.
The second quarter that ended 30 June 2019 saw the UK-based global professional services firm earn revenue of $2.6bn (£2.11bn), which was up by 2% compared to $2.56bn (£2.08bn) reported in Q2 2018. The increased revenue in the current reported quarter was owing to the 6% organic revenue growth, said the company.
Aon’s total operating expenses in Q2 2019 came down 15% to $2.19bn (£1.78bn) compared to $2.57bn (£2.08bn) reported in the same quarter in 2018. The company spent $127m (£103.02m) on restructuring in the second quarter, which was mainly caused by workforce reductions and other costs related to restructuring and separation initiatives.
Revenue of Aon’s commercial risk solutions unit in Q2 2019 was $1.167bn (£950m) compared to $1.166bn (£950m) in Q2 2018. The company said that the increase in revenue was driven by solid growth across the globe, especially in the US, EMEA and the Pacific.
The reinsurance solutions unit earned $420m (£340.7m) in the reported quarter compared to $380m (£308.25m) in the same period last year. Aon said that the results were offset partially by an unfavorable impact from some of the businesses it sold during the quarter.
The health solutions business increased its revenue from $309m (£250.66m) in the second quarter of 2018 to $317m (£257.15m) in the current reported quarter. On the other hand, the data and analytics services business had a revenue increase of $9m (£7.3m) to $286m (£232m) in Q2 2019 compared to the same quarter in 2018.
Aon CEO Greg Case said: “Our second quarter results reflect continued progress and momentum from our Aon United initiatives, highlighted by strong organic revenue growth of 6% for the fourth consecutive quarter and substantial operating margin improvement of 240 basis points.
“The steps we are taking to lead Aon United in response to increasing client demand combined with significant investment in content and capability, is not only amplifying our ability to serve clients, but also our ability to deliver improved operational and financial performance that we believe will unlock significant shareholder value creation over the long-term.”
Diana Shipping Inc. Reports First Quarter Net Income of $3 Million

Diana Shipping Inc., a global shipping company specializing in the ownership of dry bulk vessels, reported net income of $3.0 million and net income attributed to common stockholders of $1.5 million for the first quarter of 2019, including a $4.8 million impairment loss. This compares to a net loss of $3.1 million and net loss attributed to common stockholders of $4.5 million reported in the first quarter of 2018.
Time charter revenues were $60.3 million for the first quarter of 2019, compared to $48.4 million for the same period of 2018. The increase in time charter revenues was due to increased average time charter rates that the Company achieved for its vessels during the quarter and was partly offset by decreased revenues due to the sale of two vessels in December 2018.
Full Report