
Chubb Reported First Quarter Net Income Per Share of $4.53 Versus $4.55 Prior Year, and Record Core Operating Income Per Share of $4.41, Up 15.1%

Net income was $1.89 billion versus $1.95 billion prior year and core operating income was a record $1.84 billion, up 11.8%.
P&C net premiums written were up 9.3%, or 11.0% in constant dollars, with commercial lines up 11.5% and consumer/personal lines up 9.4%. North America was up 11.3%, with growth of 11.7% in commercial lines and 9.9% in personal lines. Overseas General was up 6.0%, or 10.0% in constant dollars, with growth of 10.8% in commercial lines and 8.6% in consumer lines; Asia was up 18.6% and Europe was up 10.1%.
P&C underwriting income was $1.21 billion with a combined ratio of 86.3% compared with 84.3% prior year. P&C current accident year underwriting income excluding catastrophe losses was $1.48 billion, up 7.2%, leading to a record combined ratio of 83.4% compared with 83.5% prior year.
Pre-tax and after-tax catastrophe losses were $458 million and $382 million, respectively, compared with $333 million and $290 million, respectively, last year.
Life Insurance net premiums written increased 124.4%, or 128.7% in constant dollars, to $1.29 billion driven substantially by growth in Asia and the acquisition of the Cigna Asian business. Life Insurance segment income was $244 million, up 102%.
Pre-tax net investment income was $1.11 billion, up 34.7%, and adjusted net investment income was $1.20 billion, up 33.2%. Both were records.
Annualized return on equity (ROE) was 14.6% and annualized core operating ROE was 12.6%. Annualized core operating return on tangible equity (ROTE) was 19.4%.
Chubb Limited reported net income for the quarter ended March 31, 2023 of $1.89 billion, or $4.53 per share, and core operating income of $1.84 billion, or $4.41 per share. The P&C combined ratio was 86.3% compared to 84.3% prior year, and the current accident year P&C combined ratio excluding catastrophe losses was 83.4% compared to 83.5% prior year. Book value per share and tangible book value per share increased 5.0% and 8.7%, respectively, from December 31, 2022. Book value was favorably impacted by after-tax net realized and unrealized gains of $1.70 billion in the company’s investment portfolio. In addition, the change in valuation of the long-duration contracts and market risk benefits, including required updates from Long-Duration Targeted Improvements (LDTI), resulted in realized and unrealized losses of $248 million after-tax. Book value per share and tangible book value per share now stand at $127.94 and $78.84, respectively.
Chubb LimitedFirst Quarter Summary(in millions of U.S. dollars, except per share amounts and ratios)(Unaudited)
As Adjusted
As Adjusted
(Per Share)
2023
2022
Change
2023
2022
Change
Net income
$1,892
$1,953
(3.2) %
$4.53
$4.55
(0.4) %
Cigna integration expenses, net of tax
19
—
NM
0.05
—
NM
Amortization of fair value adjustment of acquired invested
assets and long-term debt, net of tax
(2)
9
NM
—
0.02
NM
Adjusted net realized (gains) losses, net of tax
(182)
(266)
(31.6) %
(0.45)
(0.63)
(28.6) %
Market risk benefits (gains) losses, net of tax
115
(49)
NM
0.28
(0.11)
NM
Core operating income, net of tax
$1,842
$1,647
11.8 %
$4.41
$3.83
15.1 %
Annualized return on equity (ROE)
14.6 %
13.7 %
Core operating return on tangible equity (ROTE)
19.4 %
17.1 %
Core operating ROE
12.6 %
11.4 %
“As Adjusted”: Financial data for 2022 are adjusted, as applicable, and presented in accordance with the LDTI U.S. GAAP guidance adopted on 1/1/2023. Refer to page 5 for additional information.
Evan G. Greenberg, Chairman and Chief Executive Officer of Chubb Limited, commented: “We began the year with a record quarter that included double-digit core operating earnings growth, broad-based double-digit premium revenue growth globally, an 86.3% published combined ratio, net investment income up more than 30%, and life insurance segment income that more than doubled, driven by our Asia life operations. In this period of economic uncertainty and financial market volatility, Chubb’s business model, capabilities, and ability to deliver provide both a safe haven and long-term growth opportunity for shareholders.
“We grew per share operating earnings 15% on the back of record core operating income. With $1.2 billion in underwriting income and a world-class combined ratio, our P&C underwriting performance was simply excellent in what was an active quarter for natural catastrophes. Excluding CATs, our underlying current accident year combined ratio was a record 83.4%. On the investment side, adjusted net investment income was a record $1.2 billion, up $300 million from prior year. Our investment income continues to grow steadily and contribute to our earning power.
“Total company net written premiums increased 16.6%, or 18.3% in constant dollars, which included growth of 11% in our P&C business and 129% in our life division. Growth was balanced and broad-based with double-digit results in North America, Europe and Asia. By example, commercial P&C premiums in North America and Europe were both up about 12% in constant dollars, and total P&C in Asia grew about 18.5%. In North America, both P&C rate and price increases re-accelerated in the quarter with commercial P&C pricing increasing 11.2%. In our retail international operations, pricing was up about 8%.
“In sum, we had a strong start to the year with good momentum heading into the second quarter. Overall, the fundamentals for our business are excellent. Looking forward, we are confident in our ability to continue growing revenue and operating earnings, which in turn drive EPS, through the three engines of P&C underwriting income, investment income, and life income.”
Operating highlights for the quarter ended March 31, 2023 were as follows:
As Adjusted
Chubb Limited
Q1
Q1
(in millions of U.S. dollars except for percentages)
2023
2022
Change
Consolidated
Net premiums written (increase of 18.3% in constant dollars)
$
10,710
$
9,189
16.6 %
P&C
Net premiums written (increase of 11.0% in constant dollars)
$
9,417
$
8,613
9.3 %
Underwriting income
$
1,213
$
1,283
(5.5) %
Combined ratio
86.3 %
84.3 %
Current accident year underwriting income excluding catastrophe losses
$
1,475
$
1,376
7.2 %
Current accident year combined ratio excluding catastrophe losses
83.4 %
83.5 %
Global P&C (excludes Agriculture)
Net premiums written (increase of 8.3% in constant dollars)
$
9,124
$
8,551
6.7 %
Underwriting income
$
1,212
$
1,231
(1.6) %
Combined ratio
86.1 %
85.0 %
Current accident year underwriting income excluding catastrophe losses
$
1,450
$
1,350
7.4 %
Current accident year combined ratio excluding catastrophe losses
83.4 %
83.6 %
Life Insurance
Net premiums written (increase of 128.7% in constant dollars)
$
1,293
$
576
124.4 %
Segment income (increase of 106.3% in constant dollars)
$
244
$
121
102.0 %
Consolidated net premiums earned increased 16.1%, or 17.7% in constant dollars. P&C net premiums earned increased 8.3%, or 9.8% in constant dollars.
Operating cash flow was $2.25 billion for the quarter.
Total pre-tax and after-tax P&C catastrophe losses, net of reinsurance and including reinstatement premiums, were $458 million (5.1 percentage points of the combined ratio) and $382 million, respectively, compared with $333 million (4.0 percentage points of the combined ratio) and $290 million, respectively, last year.
Total pre-tax and after-tax favorable prior period development were $196 million (2.2 percentage points of the combined ratio) and $149 million, respectively. The $196 million in pre-tax development was comprised of $202 million in favorable non-catastrophe development and $6 million in adverse catastrophe-related development. This compares with $240 million (3.2 percentage points of the combined ratio) pre-tax and $195 million after-tax, last year.
Total capital returned to shareholders in the quarter was $772 million, including share repurchases of $428 million at an average purchase price of $212.81 per share, and dividends of $344 million.
Details of financial results by business segment are available in the Chubb Limited Financial Supplement. Key segment items for the quarter ended March 31, 2023 are presented below:
As Adjusted
Chubb Limited
Q1
Q1
(in millions of U.S. dollars except for percentages)
2023
2022
Change
Total North America P&C Insurance
(Comprising NA Commercial P&C Insurance, NA Personal P&C Insurance and NA Agricultural Insurance)
Net premiums written
$
5,877
$
5,281
11.3 %
Combined ratio
86.1 %
80.6 %
Current accident year combined ratio excluding catastrophe losses
81.1 %
81.2 %
North America Commercial P&C Insurance
Net premiums written (1)
$
4,288
$
4,039
6.2 %
Major accounts retail and excess and surplus (E&S) wholesale
$
2,483
$
2,336
6.3 %
Middle market and small commercial
$
1,805
$
1,703
6.0 %
Combined ratio
83.2 %
81.1 %
Current accident year combined ratio excluding catastrophe losses
81.2 %
81.7 %
North America Personal P&C Insurance
Net premiums written
$
1,296
$
1,180
9.9 %
Combined ratio
93.9 %
83.5 %
Current accident year combined ratio excluding catastrophe losses
80.6 %
79.6 %
North America Agricultural Insurance
Net premiums written
$
293
$
62
369.2 %
Combined ratio
99.2 %
NM
Current accident year combined ratio excluding catastrophe losses
83.9 %
79.5 %
Overseas General Insurance
Net premiums written (increase of 10.0% in constant dollars)
$
3,263
$
3,079
6.0 %
Commercial P&C (increase of 10.8% in constant dollars)
$
2,093
$
1,970
6.2 %
Consumer P&C (increase of 8.6% in constant dollars)
$
1,170
$
1,109
5.6 %
Combined ratio
84.0 %
88.9 %
Current accident year combined ratio excluding catastrophe losses
85.1 %
85.5 %
Life Insurance
Net premiums written (increase of 128.7% in constant dollars)
$
1,293
$
576
124.4 %
Segment income (increase of 106.3% in constant dollars)
$
244
$
121
102.0 %
(1)
Net premiums written increased 7.6% adjusting for the impact of loss portfolio transfer transactions year-over-year.
North America Commercial P&C Insurance: The combined ratio increased 2.1 percentage points, primarily reflecting the impact of higher catastrophe losses and modestly lower favorable prior period development. Prior period development comprised $112 million of favorable development, partially offset by a charge of $40 million related to development from 2022 late-season catastrophes. The favorable development of $112 million compares with favorable development of $108 million in the prior year quarter.
North America Personal P&C Insurance: The combined ratio increased 10.4 percentage points, about half of which is due to the impact of higher catastrophe losses in the current quarter. The remaining increase was primarily related to a reserve release in the prior year quarter due to lower than expected paid and reported loss activity attributable to the indirect effects of COVID related economic slowdown.
North America Agricultural Insurance: The current accident year combined ratio excluding catastrophe losses increased 4.4 percentage points, including a 1.5 percentage point increase in the loss ratio from a year-over-year impact from the company’s crop commodity price hedge activity which produced a loss this quarter versus a gain last year, and a 1.9 percentage point increase in the expense ratio related to the federal government program’s risk-sharing formula.
Overseas General Insurance: The combined ratio decreased 4.9 percentage points primarily reflecting 1.7 percentage points from lower catastrophe losses and 2.8 percentage points from higher favorable prior period development. Favorable prior period development of $143 million comprised $43 million related to development from 2022 late-season catastrophes and other development of $100 million. The favorable development of $100 million net of catastrophes development compares with favorable development of $60 million in the prior year quarter.
All comparisons are with the same period last year unless otherwise specifically stated. Please refer to the Chubb Limited Financial Supplement, dated March 31, 2023, which is posted on the company’s investor relations website, investors.chubb.com, in the Financials section for more detailed information on individual segment performance, together with additional disclosure on reinsurance recoverable, loss reserves, investment portfolio, and debt and capital.
Chubb Limited will hold its first quarter earnings conference call on Wednesday, April 26, 2023 beginning at 8:30 a.m. Eastern. The earnings conference call will be available via live webcast at investors.chubb.com or by dialing 877-400-4403 (within the United States) or 332-251-2601 (international), passcode 1641662. Please refer to the Chubb website under Events and Presentations for details. A replay will be available after the call at the same location. To listen to the replay, please click here to register and receive dial-in numbers.
“As Adjusted”: Effective January 1, 2023, the company adopted the Long-Duration Targeted Improvements (LDTI) U.S. GAAP guidance, which principally impacted the Life Insurance segment. LDTI requires more frequent updating of assumptions and a standardized discount rate for long-duration contracts, a requirement to use the fair value measurement model for policies with market risk benefits and amortization of deferred acquisition costs on a constant level basis. Under LDTI, the company’s reinsurance programs covering variable annuity guarantees (principally guaranteed minimum death benefits and guaranteed minimum income benefits) meet the definition of market-risk benefits (MRB) and are measured at fair value and are now reported within “Market risk benefits” in the financial statements. The impact to 2022 results was immaterial.
TOP Ships Announces a 412% Increase in Net Income for the Six Months Ended June 30
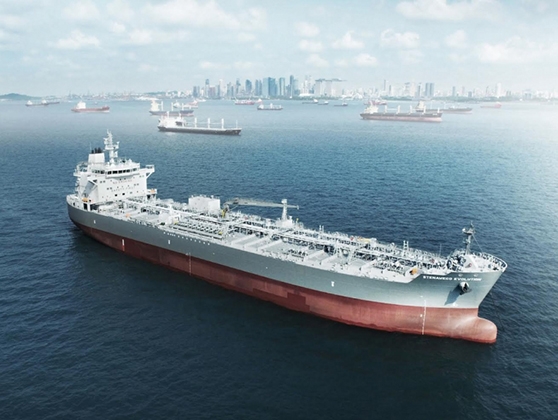
TOP Ships Inc., an international owner and operator of modern, fuel efficient “ECO” tanker vessels, announced its unaudited financial results for six months ended June 30, 2022.
For the six months ended June 30, 2022, the Company reported:
– Total revenues of $38.8 million (53% increase from 1st half 2021)- Net Income of $8.6 million (412% increase from 1st half 2021)- Adjusted EBITDA of $26.9 million* (88% increase from 1st half 2021)- Total Assets of $475.4 million (44% increase from December 31, 2021)
Evangelos Pistiolis, the President, Chief Executive Officer and Director of the Company, said:
“We are very happy to report a dramatic year-on-year increase in net income for the six months ended June 30, 2022, which represents our highest reported net income for a six month period since 2005″.
Castor Maritime Inc. Reports Net income of $27.8 Million for the Three Months Ended June 30, 2022 and $47.7 Million Net income for the Six Months Ended June 30, 2022
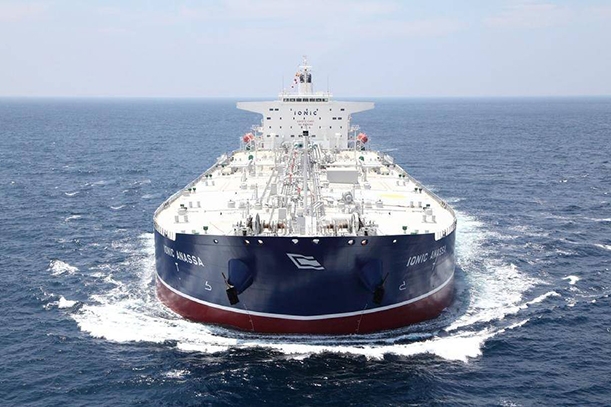
Castor Maritime Inc. (NASDAQ: CTRM) (“Castor” or the “Company”), a diversified global shipping company, today announced its results for the three months and six months ended June 30, 2022.
Highlights of the Second Quarter Ended June 30, 2022:
– Revenues, net: $67.5 million for the three months ended June 30, 2022, as compared to $21.8 million for the three months ended June 30, 2021, or a 209.6% increase;- Net income: $27.8 million for the three months ended June 30, 2022, as compared to $6.5 million for the three months ended June 30, 2021, or a 327.7% increase;- Earnings per common share: $0.29 earnings per share for the three months ended June 30, 2022, as compared to earnings per share of $0.07 for the three months ended June 30, 2021;- EBITDA(1): $36.0 million for the three months ended June 30, 2022, as compared to $10.0 million for the three months ended June 30, 2021;- Cash and restricted cash of $115.3 million as of June 30, 2022, as compared to $43.4 million as of December 31, 2021; and- Delivery of the M/T Wonder Arcturus to its new owners on July 15, 2022, after entering into an agreement to sell the vessel on May 9, 2022 for $13.15 million, resulting in an expected capital gain of $3.7 million before expenses in the third quarter of 2022.
Earnings Highlights of the Six Months Ended June 30, 2022:
– Revenues, net: $122.1 million for the six months ended June 30, 2022, as compared to $28.8 million for the six months ended June 30, 2021, or a 324.0% increase;- Net income: Net income of $47.7 million for the six months ended June 30, 2022, as compared to net income of $7.6 million for the six months ended June 30, 2021, or a 527.6% increase;- Earnings per common share: $0.50 earnings per share for the six months ended June 30, 2022, as compared to earnings per share of $0.10 for the six months ended June 30, 2021; and- EBITDA(1): $63.9 million for the six months ended June 30, 2022, as compared to $12.6 million for the six months ended June 30, 2021.
(1) EBITDA is not a recognized measure under United States generally accepted accounting principles (“U.S. GAAP”). Please refer to Appendix B for the definition and reconciliation of this measure to the most directly comparable financial measure calculated and presented in accordance with U.S. GAAP.Management Commentary:
Mr. Petros Panagiotidis, Chief Executive Officer of Castor commented:
“In the second quarter of 2022, we enjoyed the improvement of the Aframax and Handysize tanker segments earnings along with another robust quarter in the dry cargo market, with the result of Castor reporting a record net income of approximately $28 million. Our balance sheet is strong with a healthy liquidity position and low leverage. As of June 30, 2022, our free cash was approximately $104 million, which compares with total assets of $552.4 million and the Company’s market capitalization of approximately $126.8 million as of end of the first half of 2022. We continue to generate healthy cash flows, with $52.8 million of cash generated from our operations in the first half of 2022.
We did not sell any common shares under the ATM Program, which expired in June 2022, during the second quarter of 2022 and up to the date of this release. We will continue to seek attractive acquisition opportunities across the shipping space to further pursue Castor’s growth trajectory.”
Earnings Commentary:
Second Quarter ended June 30, 2022, and 2021 Results
Vessel revenues, net of charterers’ commissions, for the three months ended June 30, 2022, increased to $67.5 million from $21.8 million in the same period of 2021. This increase was largely driven by the increase in our Available Days (defined below) from 1,420 in the three months ended June 30, 2021, to 2,565 in the three months ended June 30, 2022, following the increase in the size of our fleet. The increase in vessel revenues during the three months ended June 30, 2022, as compared with the same period of 2021, was further underpinned by the continuing solid performance of the dry bulk shipping market and the improved Aframax and Handysize tanker vessel earnings as compared to the same period of 2021.
The increase in voyage expenses, to $11.8 million in the three months ended June 30, 2022, from $1.4 million in the same period of 2021, is mainly associated with the expansion of our tanker fleet. The expansion of our tanker fleet resulted in: (i) increased bunkers consumption and port expenses during the three months ended June 30, 2022, as our larger tanker fleet operated mostly under voyage charters (under which we bear such expenses) during the three months ended June 30, 2022, compared to the three months ended June 30, 2021 when our tankers were primarily employed under time charter contracts (under which case such expenses are borne by our charterers), and (ii) increased brokerage commission expenses, corresponding to the increase in vessel revenues discussed above.
The increase in vessel operating expenses by $8.4 million, from $8.0 million in the three months ended June 30, 2021 to $16.4 million in the same period of 2022, as well as the increase in vessels’ depreciation and amortization costs by $3.1 million, from $3.0 million in the three months ended June 30, 2021 to $6.1 million in the same period of 2022, mainly reflect the increase in our Ownership Days following the expansion of our fleet and increased maintenance and insurance costs for certain of our vessels.
General and administrative expenses in the three months ended June 30, 2022, amounted to $1.1 million, whereas, in the same period of 2021 general and administrative expenses totaled $0.7 million. This increase stemmed from higher corporate fees primarily due to the growth of our company.
Management fees in the three months ended June 30, 2022, amounted to $2.2 million, whereas, in the same period of 2021 management fees totaled $1.8 million. This increase in management fees is due to the substantial increase in our Ownership Days for which our managers charge us with a daily management fee, following the acquisitions discussed above.
During the three months ended June 30, 2022, we incurred net interest costs and finance costs amounting to $1.7 million compared to $0.5 million during the same period in 2021. The increase is due to our higher level of weighted average indebtedness during the three months ended June 30, 2022, as compared with the same period of 2021.
Recent Financial and Business Developments Commentary:
Equity update
On June 15, 2022, the amended and restated equity distribution agreement with the agent under our at-the-market common stock offering program (“ATM Program”) expired. From January 1, 2022 to date, no sales of common shares took place under the ATM Program and there have been no warrant exercises under our outstanding warrant schemes. As of August 5, 2022, we had issued and outstanding 94,610,088 common shares.
Liquidity/ Financing/ Cash flow update
Our consolidated cash position as of June 30, 2022, increased by $71.9 million, to $115.3 million, as compared with our cash position on December 31, 2021. During the six-month period ended June 30, 2022, our cash position improved mainly as a result of: (i) $52.8 million of net operating cash flows generated, and (ii) net financing cash inflows of approximately $54.3 million following our entry into one secured loan facility in January 2022. From these amounts, during the six months ended June 30, 2022, we used $23.1 million to fund the acquisition of the M/V Magic Callisto and other capital expenditures of our fleet, whereas $12.1 million were used for scheduled principal repayments of our debt.
As of June 30, 2022, our total debt, gross of unamortized deferred loan fees, was $146.7 million of which $30.3 million is repayable within one year, as compared to $103.8 million of gross total debt as of December 31, 2021.
Completion of sale of the M/T Wonder Arcturus
On July 15, 2022, we completed the previously announced sale of the M/T Wonder Arcturus by delivering the vessel to its new owners. The Company expects to record during the third quarter of 2022 a gain on the sale of the subject vessel of approximately $3.7 million, excluding any transaction related costs.
Costamare Inc. Reports Nearly Double First Quarter Net Income, Has Covered 100% of 2022 and 95% of 2023 Available Days
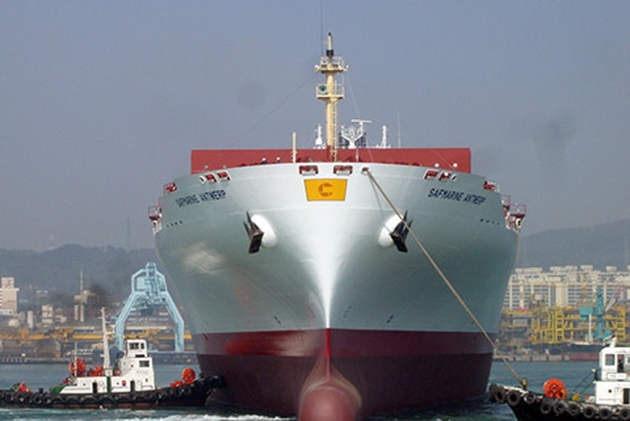
Costamare Inc. reported unaudited financial results for the first quarter ended March 31, 2022 (“Q1 2022”).
I. RECORD PROFITABILITY IN A FIRST QUARTER SINCE NYSE LISTING
Q1 2022 Net Income available to common stockholders of $115.4 million ($0.93 per share) vs $60.5 million ($0.49 per share) in Q1 2021.
Q1 2022 Adjusted Net Income available to common stockholders1 of $104.5 million ($0.84 per share) vs $38.0 million ($0.31 per share) in Q1 2021.
Q1 2022 liquidity of $644 million2 vs $240 million in Q1 2021.
II. NEW CHARTER ARRANGEMENTS3 AND FULLY EMPLOYED CONTAINERSHIP FLEET FOR THE YEAR AHEAD
Containership fleet fully employed for the remainder of 2022.More than 90% of the containership fleet4 is fixed for 2023.Entered into a total of 49 chartering agreements for the dry bulk fleet since the beginning of 2022.
Selected fixtures are shown below:
– Charter of the 2012-built, 63,227 DWT dry bulk vessel Damon at a daily rate of $35,000 for a period of approximately one month.
– Charter of the 2010-built, 58,018 DWT dry bulk vessel Norma at a daily rate of $45,000 for a period of approximately 70 days.
– Charter of the 2010-built, 56,729 DWT dry bulk vessel Libra at a daily rate of $37,000 for a period between 50 and 120 days.
– Charter of the 2010-built, 32,527 DWT dry bulk vessel Cetus at a daily rate of $24,000 for a period of approximately one month.
III. SALE AND PURCHASE ACTIVITY
– Delivery of the 2010-built 58,018 DWT dry bulk vessel Norma (ex. Magda).- Agreement for the sale of the 2009-built, 57,334 DWT dry bulk vessel Thunder. The sale is expected to be concluded in Q2 2022 and will result in an estimated capital gain of $3.6 million.- Conclusion of the sale and delivery of the 1997-built, 2,458 TEU containership Messini, which resulted in a capital gain of $17.8 million.
IV. NEW DEBT FINANCING
New financing agreements for an amount of $160.5 million. More specifically:
In April 2022, we signed a hunting license loan agreement with a European financial institution for an amount of up to $120 million for the purposes of financing the acquisition cost of dry bulk vessels. The availability period of this facility expires in Q2 2023, an amount of $10.8 million has already been drawn down and the facility has a maximum tenor of five years following the expiration of the availability period.
In April 2022, we signed a loan agreement with a leading European financial institution for an amount of $40.5 million for the purposes of refinancing the existing indebtedness of four dry bulk vessels. The new facility has a tenor of four years, and will mature in April 2026.
V. DIVIDEND ANNOUNCEMENTS
On April 1, 2022, we declared a special dividend of $0.50 per share on our common stock and a dividend for the quarter ended March 31, 2022, of $0.115 per share on our common stock, both of which are due to be paid on May 5, 2022, to stockholders of record of common stock as of April 19, 2022.On April 1, 2022, we declared a dividend of $0.476563 per share on our Series B Preferred Stock, $0.531250 per share on our Series C Preferred Stock, $0.546875 per share on our Series D Preferred Stock and $0.554688 per share on our Series E Preferred Stock, which were all paid on April 18, 2022 to holders of record as of April 14, 2022.
Mr. Gregory Zikos, Chief Financial Officer of Costamare Inc., commented:“During the quarter the Company delivered strong results; revenues more than doubled to approx. $270 million and Net Income reached $115 million, compared to $60 million for the same period of last year. As of quarter end, liquidity stood at $640 million.
Fundamentals and strong charter rates for the container market remain unchanged; a commercially fully employed container fleet with no vessels available on short notice. Congestion shows no signs of easing, while recent events are in fact contributing to further increases.
In such an opportune market environment we have covered all of our containership open days for 2022 and we have ca. 95% coverage for 2023. Contracted revenues for the containership fleet in the water amount to $3.3 billion with a remaining time charter duration of 4.1 years.
On the dry bulk side, the market continues to be strong with smaller ships earning a premium to the larger ones, also benefiting from container spillover. Supply and demand dynamics remain healthy underpinned by a historically low orderbook.”
Costamare Reports 2021 Net Income of $404 Million

Costamare Inc. reported unaudited financial results for the fourth quarter (“Q4 2021”) and year ended December 31, 2021.
I. RECORD PROFITABILITY FOR Q4 2021 AND YEAR ENDED 2021
– Year end Net Income available to common stockholders of $404.1 million ($3.28 per share).Q4 2021 Net Income available to common stockholders of $153.4 million ($1.24 per share).- Year end Adjusted Net Income available to common stockholders1 of $289.9 million ($2.36 per share).Q4 2021 Adjusted Net Income available to common stockholders1 of $112.1 million ($0.91 per share).- Year end liquidity of $552 million.
II. SPECIAL DIVIDEND
The Company has decided to declare a special dividend of $0.50 per common share. The special dividend will be in addition to the regular first quarter 2022 dividend and will be paid at the same time as, and using the same record date as, the regular first quarter 2022 dividend.III. SALE AND PURCHASE ACTIVITY
Vessels Disposals
– Agreement for the sale with forward delivery of the below two containerships (average age 21 years):c/v Maersk Kalamata, 2003-built, 6,644 TEU capacity (latest expected date for the conclusion of the sale in Q1 2023).- c/v Sealand Washington, 2000-built, 6,648 TEU capacity (latest expected date for the conclusion of the sale in Q1 2023).- Total gross sale proceeds are estimated to be $150 million, resulting in an estimated capital gain of $95 million.
– Agreement for the sale with forward delivery of the below three containerships (average age 22 years):c/v Sealand Michigan, 2000-built, 6,648 TEU capacity (latest expected date for the conclusion of the sale in Q4 2022).- c/v Sealand Illinois, 2000-built, 6,648 TEU capacity (latest expected date for the conclusion of the sale in Q4 2022).- c/v York, 2000-built, 6,648 TEU capacity (latest expected date for the conclusion of the sale in Q4 2022).- Total gross sale proceeds are estimated to be $183 million, resulting in an estimated capital gain of $109 million.
– Agreement for the sale of the 1997-built, 2,458 TEU containership Messini. The sale is expected to be concluded in Q1 2022 and will result in an estimated capital gain of $17.8 million.- Conclusion of the sale of the 2002-built, 4,992 TEU containership ZIM New York, which resulted in a capital gain of approximately $14.0 million.- Total estimated capital gains from vessel disposals of $235.8 million.
Vessels Acquisitions
– Accepted delivery of the 2008-built, 4,578 TEU containership Dyros (ex. Co Kobe), which commenced its time charter with Maersk for a period of between 24.5 to 27.5 months. The vessel acquisition price was $20.0 million.- Accepted delivery of another 11 dry bulk vessels (total delivered fleet of 45 vessels), with one additional vessel expected to be delivered in Q1 2022.
IV. NEW CHARTER ARRANGEMENTS3
Entered into a total of 35 chartering agreements for our containerships with contracted revenues of $1.4 billion in the aggregate since the beginning of 2021, bringing our contracted revenues to a total of $3.4 billion with a weighted average remaining time charter duration of 4.2 years4.
Selected fixtures of the Company’s containerships since last quarter are shown below:
– Charter on a forward basis with latest delivery to the charterer in Q4 2023, three 1996-built vessels ranging between 7,400 to 8,000 TEU capacity, for a minimum fixed period of 36 months at a daily rate of $41,500 each. More specifically:- c/v Kure of 7,403 TEU capacity and latest delivery to its new charterers in August 2023.- c/v Maersk Kleven of 8,044 TEU capacity and latest delivery to its new charterers in October 2023.- c/v Maersk Kotka of 8,044 TEU capacity and latest delivery to its new charterers in October 2023.
– Charter on a forward basis with latest delivery to the charterer in Q4 2022, two 2003-built vessels of 6,500 TEUs for a minimum fixed period of 36 months at a daily rate of $53,000 each. More specifically:- c/v Maersk Kolkata of 6,644 TEU capacity and latest delivery to its new charterers in October 2022.- c/v Maersk Kingston of 6,644 TEU capacity and latest delivery to its new charterers in October 2022.
– Charter on a forward basis with latest delivery to the charterer in Q2 2023, two 2009/2010-built vessels of 4,250 TEUs for a minimum fixed period of 60 months at an average daily rate of $43,250 each. More specifically:- c/v Vela of 4,258 TEU capacity, latest delivery to its new charterers in April 2023 and at a daily charter rate for the first year of employment at $99,000.- c/v Vulpecula of 4,258 TEU capacity, latest delivery to its new charterers in May 2023 and at a daily charter rate for the first year of employment at $99,000.
Total contracted revenues from the above seven fixtures amount to $410 million extending over the next six years5.
V. NEW DEBT FINANCING AND CAPITAL STRUCTURE
New financing agreements / amendments to existing financing agreements since last quarter in excess of $430 million. More specifically:
– In December 2021, we signed a loan agreement with a leading European financial institution for an amount of up to $55 million for the purposes of refinancing the then existing indebtedness of five dry bulk carriers. The new facility has a tenor of five years, and will mature in January 2027.- In December 2021, we signed a loan agreement with a leading European financial institution for an amount of up to $43.5 million for the purposes of refinancing the then existing indebtedness of four dry bulk carriers. The new facility has a tenor of five years, and will mature in December 2026.- In December 2021, we signed a hunting license loan agreement with a European financial institution for an amount of up to $100 million for the purposes of financing the acquisition cost of dry bulk vessels. The availability period of this facility expires in December 2022, an amount of $56.7 million has already been drawn and the facility has a maximum tenor of 5 to 6 years following the expiration of the availability period.- In December 2021, we extended the availability period of the $150 million hunting license loan facility agreement, originally signed in September 2021. The new availability period expires in June 2022.- In January 2022, we signed a loan agreement with a leading European financial institution for an amount of up to $85 million for the purposes of refinancing the then existing indebtedness of five containerships and for general corporate purposes. The new facility has a tenor of four years and will mature in January 2026.
VI. SHARE REPURCHASE PROGRAM AND DIVIDEND ANNOUNCEMENTS
– On November 30, 2021, we approved a share repurchase program of up to a maximum $150 million of our common shares and up to a maximum $150 million of our preferred shares. The timing of repurchases and the exact number of shares to be purchased will be determined by the Company’s management, in its discretion.- On January 3, 2022, we declared a dividend for the quarter ended December 31, 2021, of $0.115 per share on our common stock, which was paid on February 7, 2022, to stockholders of record of common stock as of January 20, 2022.- On January 3, 2022, we declared a dividend of $0.476563 per share on our Series B Preferred Stock, of $0.531250 per share on our Series C Preferred Stock, of $0.546875 per share on our Series D Preferred Stock and of $0.554688 per share on our Series E Preferred Stock, which were all paid on January 18, 2022 to holders of record as of January 14, 2022.
Mr. Gregory Zikos, Chief Financial Officer of Costamare Inc., commented:
“2021 has been a record year for Costamare. With a fleet of 123 vessels, including 46 dry bulk ships, the Company generated Net Income of above $400 million. As of the end of the year, liquidity stood at $550 million.
On the containerships side, market conditions remained firm with strong demand and logistical disruptions continuing to impact the sector. We chartered a total of 35 secondhand vessels during the year, which added incremental contracted revenues of $1.4 billion. Total contracted revenues amount to $3.4 billion with a weighted average remaining time charter duration of about 4 years.
We have covered substantially all of our containership open days for 2022 and are in the process of arranging employment for the vessels coming off charter next year. At the same time, we agreed to dispose of some older tonnage with forward, year-end deliveries at prices that reflect today’s tight market environment.
Regarding our expansion into the dry bulk shipping business, we entered a market with favorable supply and demand dynamics underpinned by a historically low orderbook. Our dry bulk fleet is currently trading in the spot market generating healthy returns, on the back of timely acquisitions.
In light of the above, the Company has decided to declare a special dividend of $0.50 per common share. While rewarding our shareholders as a result of increased cash flows and profitability, the payment of that dividend is not expected in any way to affect our capacity to continue growing opportunistically in a volatile market environment.”
View Full Press Release
Chubb Reports Fourth Quarter Net Income Per Share of $4.95 Versus $5.34 Prior Year, and Record Core Operating Income Per Share of $3.81, Up 19.8%

Record Full-Year Per Share Net Income and Core Operating Income of $19.27 and $12.56, Up 147.4% and 71.8%, Respectively; Consolidated Net Premiums Written of $38 Billion, Up 12%, with Commercial Lines Up 17.7%
– Fourth quarter net income was $2.14 billion and core operating income was a record $1.65 billion.
– Fourth quarter P&C underwriting income was a record $1.27 billion, up 30.7%. P&C combined ratio was 85.5%, compared with 87.6% prior year. P&C current accident year underwriting income excluding catastrophe losses was $1.40 billion, up 31.8%. P&C current accident year combined ratio excluding catastrophe losses was a record 83.9%, compared with 86.4% prior year.
– Fourth quarter consolidated net premiums written were up 8.8%. P&C net premiums written were up 9.6%, driven by growth in commercial lines of 12.9%. Total North America P&C net premiums written were up 8.7%, including growth in commercial lines of 11.2%. Overseas General P&C net premiums written were up 10.2%, including growth in commercial lines of 15.0% and consumer lines of 3.2%.
– Record full-year net income and core operating income were $8.54 billion and $5.57 billion, up 141.7% and 68.1%, respectively.
– Full-year P&C underwriting income was a record $3.70 billion, up 205.4%, and record P&C current accident year underwriting income excluding catastrophe losses was $5.17 billion, up 26.9%. P&C combined ratio was 89.1%, compared with 96.1% prior year, and P&C current accident year combined ratio excluding catastrophe losses was a record 84.8%, compared with 86.7% prior year.
– Full-year P&C net premiums written were up 13.0%, the strongest organic growth in over 15 years, driven by commercial lines growth of 17.7%. Total North America P&C net premiums written were up 12.1%, including growth in commercial lines of 16.4%. Overseas General P&C net premiums written were up 14.8%, including growth in commercial lines of 21.4% and consumer lines of 5.6%.
– Record full-year pre-tax net investment income and adjusted net investment income were $3.46 billion and $3.72 billion, respectively.
– During the quarter, the company entered into agreements with several shareholders to purchase additional ownership interests in Huatai Group, a Chinese financial services holding company that, upon regulatory approval of all outstanding agreements, will bring Chubb’s total aggregate ownership to 86.1%.
View Full Press Release
Talanx generates Group net income of EUR 723 million and is on track to meet its annual target in full
Gross written premiums up 10.2 percent to EUR 35.2 (33.0) billion
Impact of coronavirus pandemic now only to be seen in the Life/Health Reinsurance segment
Gross claims from flood event in western Europe exceed EUR 1 billion
Operating profit of EUR 1.8 (1.3) billion
Group net income of EUR 723 (520) million almost at pre-pandemic 2019 level
Combined ratio of 97.6 (100.7) percent
Full-year forecast for 2021: Group net income at upper end of the EUR 900–950 million range
Full-year forecast for 2022 substantially higher: Group net income of EUR 1,050–1,150 million expected
After the first nine months of the year, the Talanx Group is on track to hit its annual target for Group net income of EUR 900–950 million. The insurance group, which rejoined Germany’s MDAX mid-cap equity index at the end of October, generated Group net income of EUR 723 (520) million as at 30 September, despite higher large losses from natural disasters. The once-in-a-century floods seen in western Europe led in their own right to gross losses of more than EUR 1 billion. Despite this, the Group’s net income was almost at the level of 2019 (EUR 742 million), the year before the coronavirus pandemic. The pandemic impact declined gradually over the first nine months with the exception of the Life/Health Reinsurance segment. The negative effects of the coronavirus crisis on Group net income amounted to EUR 9 million in the third quarter, while the aggregate impact for the first nine months was EUR 81 million. Gross written premiums rose by double digits (10.2 percent) to EUR 35.2 (31.9) billion; after adjustment for exchange rate effects, the figure was 12.3 percent. All segments contributed to this performance. The combined ratio was 97.6 (100.7) percent. Looking forward to financial year 2022, the Talanx Group is anticipating earnings in excess of the EUR 1 billion mark for the first time. Next year’s Group net income is expected to be in the range of EUR 1,050–1,150 million.
“We have successfully weathered the coronavirus pandemic together. Our nine-month results put us almost back at the high level seen in 2019. We can achieve our targets for 2021 despite the substantial rise in large losses from natural disasters, especially in Q3”, said Torsten Leue, Chairman of Talanx AG’s Board of Management. “This clearly shows that our strategy and our modernisation programmes for the divisions are bearing fruit and have resulted in profitable growth. Our reserving policy has enhanced our resilience. We want to continue this journey so as to successfully meet future challenges as well. Our goal for 2022 is for Group net income to top the EUR 1 billion mark for the first time.”
The continuous improvement measures are also reflected favourably in the divisional results for the current reporting period. The improved profitability at Industrial Lines is having a positive effect. The Retail Germany Division has almost reached its annual “KuRS” programme target after only nine months. Retail International also saw clear growth in the first nine months thanks among other things to the acquisition of Amissima Assicurazioni S.p.A., which has been fully consolidated since 1 April 2021.
The impact of the coronavirus pandemic declined gradually over the reporting period. Only the Life/Health Reinsurance segment is still seeing a continuing high impact, which depressed operating profit by EUR 404 million as at 30 September. Whereas the coronavirus crisis pushed down Group net income by EUR 81 million in the first nine months, only EUR 9 million of this figure was attributable to the third quarter. Exchange rate losses also depressed results, especially in Industrial Lines and Reinsurance.
At EUR 1.5 (1.6) billion, large losses were similar to the prior-year period, due in particular to large losses from natural disasters. Hurricane “Ida” in North America and the western European floods caused by low-pressure system “Bernd” had a particularly negative effect – the catastrophic flooding alone resulted in losses of more than EUR 1 billion (gross) and EUR 321 million (net).
All in all, net large losses from natural disasters amounted to EUR 1.1 billion in the period up to 30 September. Large man-made losses were EUR 394 million. Large losses in the Reinsurance Division totalled EUR 1.1 billion, while the figure for primary insurance was EUR 391 million. The figures for large losses exceeded the pro rata nine-month budget of approximately EUR 1.2 (1.0) billion and almost reached the full-year budget of EUR 1.5 (1.3) million. At EUR 956 million, the third quarter accounted for almost two-thirds of all large losses for the reporting period.
Nine-month operating profit climbed tangibly compared to the prior-year quarter, to EUR 1.8 (1.3) billion. The underwriting result rose to EUR –1.6 (–2.0) billion thanks among other things to a clear improvement in the Property/Casualty Insurance segment. Net investment income increased by 13.7 percent to EUR 3.5 (3.1) billion, largely due to higher income from alternative investments and the realisation of hidden reserves to finance the Zinszusatzreserve (ZZR – additional interest reserve). Excluding transitional measures, the Solvency 2 ratio as at 30 September 2021 was 204 (30 June 2021: 210) percent.
Third quarter: Significant impact from natural disasters
Third-quarter gross written premiums rose by 11.9 percent to EUR 11.1 (9.9) billion, with all the divisions recording premium growth. The underwriting result improved to EUR –622 (–843) million, despite higher large losses from natural disasters in particular. These events pushed up the combined ratio to 100.9 (99.7) percent. Net investment income fell by 11.5 percent to EUR 1.1 (1.3) billion, largely due to a decline in net gains on disposal and the realisation of hidden reserves to finance the ZZR, which was largely completed in the first half of the year. Operating profit was EUR 506 (546) million, while Group net income was EUR 177 (194) million.
Industrial Lines: Higher premiums from growth in the specialty and third-party liability business – Group net income of EUR 101 million
Gross written premiums in the Industrial Lines Division rose by 11.6 percent to EUR 5.8 (5.2) billion. Adjusted for exchange rate effects, the increase was even higher, at 13.0 percent. Premium growth was mainly attributable to growth in the specialty and third-party liability businesses. The nine-month underwriting result was EUR 35 (–107) million, despite high claims expenses from natural disasters and man-made losses. This figure was significantly higher than in the prior-year period, which was strongly affected by the coronavirus pandemic. It clearly shows how effective the measures taken improve the division’s profitability have been. The estimated premium attrition resulting from the coronavirus pandemic was lower than expected. The combined ratio was 98.6 (104.8) percent. The combined ratio is therefore still on track to reach the medium-term target of 95 percent, despite the accumulation of large losses caused by natural disasters. The division recorded gross losses of EUR 328 million following the heavy rains caused by low-pressure system “Bernd” in western Europe. In addition, Winter Storm “Uri” (Texas) and Hurricane “Ida” (North America) clearly impacted the result, at EUR 250 million and EUR 111 million respectively.
Net investment income was up year-on-year at EUR 220 (171) million and benefited from higher distributions from private equity investments. Operating profit climbed sharply to EUR 151 (28) million. The division contributed EUR 101 (10) million to Group net income, a substantial rise on the prior-year period.
Third quarter: Strong contribution to Group net income despite overrunning the pro rata large loss budget
Third-quarter gross written premiums increased by a clear 19.9 percent year-on-year to EUR 1.6 (1.4) billion. Growth after currency adjustments amounted to 18.3 percent. The underwriting result climbed to EUR 8 (–40) million despite overrunning the pro rata large loss budget due to natural disasters and man-made losses, while the combined ratio improved to 99.1 (105.0) percent. Net investment income rose to EUR 79 (65) million. Operating profit was EUR 54 (10) million and the contribution to Group net income jumped year-on-year to EUR 32 (3) million.
Retail Germany: Annual target for “KuRS” programme almost reached after only nine months
Gross written premiums in the Retail Germany Division increased by 3.9 percent in the first nine-months to EUR 4.6 (4.5) billion. Both the life insurance business and the Property/Casualty Insurance segment were growth drivers here. Operating profit was up significantly on the comparative period at EUR 234 (168) million, despite the flood damage caused by the low-pressure system in western Europe. This means that the “KuRS” programme target – an operating profit of at least EUR 240 million – has almost been reached after only nine months. The division’s contribution to Group net income rose to EUR 131 (102) million.
Property/Casualty Insurance segment: Growth in line with strategy
Gross written premiums in the Property/Casualty Insurance segment rose by 3.0 percent to EUR 1,308 (1,270) million. A key driver here was the 9.1 percent growth seen in the segment’s SME business, which rose to EUR 422 (387) million in line with its strategy. The nine-month underwriting result fell to EUR 31 (45) million. This was due to higher claims expenses resulting primarily from natural disasters such as the flood event in western Europe. All in all, flood victims filed well over 6,000 claims for an average amount of just under EUR 27,000. The division will pay out EUR 171 million to flood victims.
The combined ratio for the first three quarters increased to 96.8 (95.8) percent. Net investment income rose by 22.2 percent year-on-year to EUR 79 (64) million, mainly as a result of higher disposal gains and lower write-downs compared to the prior-year period. Operating profit rose slightly to EUR 99 (96) million.
Third quarter: Rise in claims expenses due to flood event in western Europe and end of the lockdown
Gross written premiums rose by 4.3 percent in the third quarter to EUR 276 (265) million. The underwriting result declined to EUR –25 (23) million. The change was driven by the rise in claims expenses due to the flood event in western Europe, plus higher attritional losses year-on-year as mobility returned to a more normal level following the end of the lockdown. Consequently, the combined ratio was 108.0 (93.6) percent. Net investment income improved by 3.6 percent to EUR 26 (25) million. An operating loss of EUR 3 million was recorded, compared to an operating profit of EUR 42 million in the prior-year period. The prior-year period had been dominated by a sharp drop in motor vehicle claims expenses due to fewer miles being driven.
Life Insurance segment: Rise in demand lifts earnings
Life insurance premiums grew by 4.3 percent in the first nine months to EUR 3.3 (3.2) billion. The strong debut by CleverInvest, the segment’s core new fund-based product, is clearly enhancing gross written premiums. The prior-year period had seen a decline in premiums due to the coronavirus pandemic. The underwriting result declined over the financial year to date to EUR –1.4 (–1.3) billion. This was mainly due to provisions for premium refunds designed to enable policyholders to participate in the positive course of business. Net investment income rose by 11.9 percent to EUR 1.6 (1.4) billion due among other things to the substantially higher hidden reserves realised to finance the ZZR and enhance the capital base. Operating profit rose sharply in line with this to EUR 135 (72) million.
Third quarter: Clear rise in operating profit
Third-quarter gross written premiums in the Life Insurance segment rose by 7.4 percent to EUR 1,124 (1,047) million. The underwriting result improved to EUR –380 (–675) million due to lower additions to the provision for premium refunds. Net investment income declined to EUR 458 (719) million due to different timing of the financing of the ZZR compared to the prior-year period. Operating profit rose clearly to EUR 80 (32) million.
Retail International: Strong growth and sound profitability
Premium growth at the Retail International Division rose by 12.4 percent year-on-year to EUR 4.5 (4.0) billion. Adjusted for exchange rate effects, the increase was even higher, at 17.0 percent. Gross written premiums in the Europe region rose by 14.9 percent (18.8 percent adjusted for exchange rate effects) to EUR 3.4 (3.0) billion. The main drivers for this were Warta in Poland in the Property/Casual and Life Insurance segments plus the first-time consolidation of recently acquired Amissima Assicurazioni, which generated premiums of EUR 131 million. HDI Sigorta in Turkey also contributed to premium growth. Gross written premiums in Latin America increased by 5.4 percent in the first nine months of 2021, to EUR 1.1 (1.0) billion. Growth after adjustment for exchange rate effects amounted to 12.1 percent. Premium growth was particularly strong in the Chilean and Mexican business, whereas HDI’s premiums in Brazil were flat after currency adjustments as a result of the strong competition there.
The underwriting result increased 14.6 percent to EUR 50 (44) million. The combined ratio fell to 94.3 (94.8) percent despite a rise in claims inflation and a return to more normal loss frequencies following the end of the coronavirus lockdown. Net investment income rose by EUR 33 million in the first nine months of the year to EUR 278 (245) million. Higher volumes of investments and higher interest rates on the Brazilian and Turkish markets in particular offset negative exchange rate effects.
Operating profit rose by 3.1 percent year-on-year to EUR 227 (220) million. Adjusted for exchange rate effects, the increase amounted to 6.2 percent. The division’s contribution to Group net income rose by 6.7 percent to EUR 135 (127) million.
Third quarter: Strong premium growth
Third-quarter gross written premiums rose by 16.2 percent to EUR 1.5 (1.3) billion. After adjustment for exchange rate effects the increase was even higher, at 18.0 percent. The underwriting result improved to EUR 3.6 (–0.5) million, while the combined ratio was 97.0 (95.9) percent. Net investment income was up 6.4 percent to EUR 84 (79) million. Operating profit amounted to EUR 54 (64) million, while the division’s contribution to Group net income was EUR 31 (38) million.
Reinsurance: Continuing impact of coronavirus pandemic and high level of large losses
Gross written premiums rose by 12.0 percent to EUR 21.6 (19.3) billion. Operating profit improved to EUR 1,290 (915) million, while the contribution to Group net income rose to EUR 427 (334) million. The Reinsurance Division lifted its growth rate in the first nine months of the year despite the continuing impact of the coronavirus pandemic on the Life/Health Reinsurance segment and high large loss expenses in the Property/Casualty Reinsurance segment.
Property/Casualty Reinsurance segment: Clear improvement in underwriting result despite increase in large losses
Gross written premiums rose by 14.4 percent year-on-year to EUR 15.3 (13.3) billion. Adjusted for currency effects, the increase amounted to 17.7 percent. The underwriting result improved sharply to EUR 219 (–187) million. The combined ratio improved by 3.5 percentage points to 97.9 (101.4) percent. Net investment income increased to EUR 1,003 (725) million. Operating profit jumped to EUR 1,076 (606) million.
No further net impact from the coronavirus pandemic has been recorded in the course of the year in this segment. At EUR 1,070 (1,149) million, net large losses were lower than in the comparative period, which was hit hard by the coronavirus pandemic. However, they still substantially exceeded the pro rata large loss budget figure for the nine-month period of EUR 849 (749) million. The Property/Casualty Reinsurance segment was hit by third-quarter large losses that considerably exceeded expectations. Reinsurance prices and conditions are improving significantly in reaction to current challenges.
In the third quarter, gross written premiums rose by 19.9 percent to EUR 5.0 (4.2) billion. The underwriting result deteriorated to EUR –80 (0) million. The combined ratio rose to 101.5 (99.6) percent. Net investment income jumped to EUR 407 (256) million. Operating profit was EUR 287 (307) million.
Life/Health Reinsurance segment: Continuing coronavirus effects of EUR 404 million
The coronavirus pandemic remained a core issue in Life/Health Reinsurance in the first nine months of the financial year, particularly in relation to mortality coverage. Pandemic-related effects in Life/Health Reinsurance amounted to EUR 404 million as at the end of September. A large proportion (around half) of the pandemic claims in the first nine months of the year relate to cases of sickness and death in the USA. A positive one-time effect of EUR 129 million in the first quarter, which resulted from restructuring measures in the US mortality business, partially offset the impact of the pandemic. In addition, the longevity business recorded a positive one-time effect of EUR 99 million in the third quarter.
Premiums in the Life/Health Reinsurance segment grew by 6.8 percent in the first nine months of the year to EUR 6.4 (5.9) billion. Growth after currency adjustments amounted to 6.9 percent. The underwriting result deteriorated to EUR –496 (–421) million. Operating profit fell by 30.7 percent to EUR 214 (309) million.
Third-quarter coronavirus effects amounted to EUR 141 million, while the longevity business recorded a positive one-time effect of EUR 99 million. Gross written premiums rose by 9.0 percent to EUR 2.2 (2.0) billion. The underwriting result fell by 7.3 percent to EUR –147 (–137) million. Net investment income declined to EUR 85 (141) million. Operating profit dropped to EUR 39 (100) million.
Outlook for 2021: Group net income at upper end of the EUR 900–950 million range
After the strong first half of financial year 2021, the Talanx Group is expecting Group net income at the upper end of the EUR 900–950 million range. This is despite the substantial losses caused by Hurricane “Ida” and the flood damage in Germany and parts of Europe, which affected the third quarter.
The Group is also expecting gross premiums to rise in the current financial year and to record a high single-digit percentage increase after adjustment for currency effects. A net return on investment of 2.7 percent is forecast. The return on equity should be approximately 9.0 percent, in excess of the strategic minimum target.
As usual, the forecasts for financial year 2021 are subject to the proviso that large losses remain in line with expectations and that no renewed significant turbulence occurs on the currency and capital markets.
Outlook for 2022: Group net income of EUR 1,050–1,150 million
Talanx is also publishing an earnings outlook for financial year 2022 together with its nine-month results. It is expecting percentage premium growth compared to 2021 to be in the mid-single digit range. The net return on investment is forecast to be approximately 2.4 percent, with the even lower interest rate environment and rising inflation expected to impact Group net income. Talanx is expecting Group net income to be in the range of EUR 1,050–1,150 million. This should correspond to a return on equity of approximately 10 percent, clearly above Talanx’s strategic minimum goal of at least 800 base points in excess of the risk-free rate.
As usual, the targets for financial year 2022 are subject to the proviso that no turbulence occurs on the currency and capital markets and that large losses are in line with expectations.
More detailed medium-term targets and the dividend proposal will be published on the occasion of Talanx’s Capital Markets Day on 17 November.
Chubb Reports Third Quarter Per Share Net Income and Core Operating Income of $4.18 and $2.64

– Net income for the quarter was strong at $1.83 billion versus $1.19 billion prior year, and core operating income was $1.16 billion versus $907 million prior year. Record per share net income and core operating income through nine months were $14.33 and $8.78, respectively.
– P&C net premiums written were up 16.9% globally for the quarter, or 15.4% in constant dollars, driven by 22.0% growth in commercial lines. Total North America P&C net premiums written were up 17.1%, including growth of 22.4% in commercial lines and 0.6% in consumer lines. Overseas General P&C net premiums written were up 15.9%, or 11.2% in constant dollars, including growth of 20.6% in commercial lines and 9.2% in consumer lines. Total company P&C net premiums written were up 14.2% through nine months.
– P&C underwriting income for the quarter was $617 million, up 57.5%, leading to a P&C combined ratio of 93.4%, compared with 95.2% prior year. P&C current accident year underwriting income excluding catastrophe losses was $1.44 billion, up 23.1%, leading to a P&C current accident year combined ratio excluding catastrophe losses of 84.8% compared with 85.7% prior year; both were record quarterly underwriting results. Excluding a one-time COVID-related frequency benefit to last year’s third quarter results, the P&C and Global P&C current accident year combined ratios excluding catastrophe losses improved 1.9 and 2.0 percentage points, respectively.
– Catastrophe losses, net of reinsurance and including reinstatement premiums, for the quarter were $1.15 billion pre-tax, or $943 million after tax, compared with $925 million pre-tax, or $797 million after tax, prior year. The current quarter included pre-tax net catastrophe losses of $806 million from Hurricane Ida.
– Pre-tax net investment income for the quarter was $866 million, up 3.1%, and adjusted net investment income was $940 million, up 4.5%, reflecting strong returns in the company’s private equity portfolio.
– Annualized return on equity (ROE) was 12.3% and annualized core operating ROE was 8.2%. For comparison purposes, including mark-to-market private equity gains, annualized core operating ROE was 13.2%. Annualized core operating return on tangible equity was 12.6%.
View Full Press Release
Swiss Re reports net income of USD 1.3 billion for first nine months of 2021

Property and Casualty Reinsurance (P&C Re) net income of USD 1.5 billion; strong combined ratio of 97.5% as impacts from large-loss events were contained by disciplined underwriting
Corporate Solutions net income of USD 425 million; very strong combined ratio of 91.1%
Life and Health Reinsurance (L&H Re) net loss narrowed to USD 62 million; excluding COVID-19 losses, net income of USD 899 million
Strong return on investments (ROI) of 3.0%
Very strong capital position with a Group Swiss Solvency Test (SST) ratio of 234% as of 1 July 2021
Excluding COVID-19 losses, Group net income of USD 2.3 billion and return on equity (ROE) of 11.7%
Driven by the performance of its property and casualty businesses, Swiss Re reported a Group net income of USD 1.3 billion in the first nine months of 2021, despite significant large-loss events, particularly in the third quarter. Swiss Re’s capital position remained very strong, with a Group SST ratio of 234% as of 1 July 2021.
Swiss Re’s Group Chief Executive Officer Christian Mumenthaler said: “Thanks to the Group’s sustained focus on portfolio quality and disciplined underwriting, our property and casualty businesses delivered excellent results in the first nine months of 2021. At the same time, we were able to support communities impacted by natural catastrophes and the COVID-19 pandemic.“
Swiss Re’s Group Chief Financial Officer John Dacey said: “P&C Re and Corporate Solutions are delivering on their ambitious targets for this year, with a combined net income of just below USD 2 billion in the first nine months. We are also pleased with the underlying performance of L&H Re, which offset the impact from the pandemic, resulting in a reported profit for the second consecutive quarter.“
Swiss Re significantly improves profitability across businesses
Swiss Re achieved strong results for the first nine months of 2021 and reported an ROE of 6.6%, against the background of the continued COVID-19 pandemic and large natural catastrophe events. Net premiums earned and fee income for the Group rose by 5.9% to USD 32.0 billion in the first nine months of 2021 compared with the same period last year, with all businesses reporting increases. Swiss Re’s net income excluding COVID-19 increased by 38% year on year to USD 2.3 billion.
Swiss Re achieved a return on investments of 3.0% in the first nine months of 2021. The investment result was largely driven by recurring income as well as equity valuation gains, combined with no credit impairments, as Swiss Re successfully navigated the low-yield environment.
P&C Re reports strong profit despite large natural catastrophe losses
P&C Re reported a net income of USD 1.5 billion in the first nine months of 2021, compared with a net loss of USD 201 million in the same period last year. This result was achieved while the business absorbed large natural catastrophe losses and reflects the improved quality of the portfolio, dramatically lower COVID-19 impacts as well as strong investment results. P&C Re’s net premiums earned grew by 6.0% to USD 16.4 billion, reflecting the continued price momentum as well as favourable foreign exchange developments.
Large natural catastrophe losses for the first nine months of the year amounted to USD 1.7 billion – higher than expected, but still below the premiums earned for this class of business. The losses mainly related to Hurricane Ida and the floods in Europe in the third quarter, as well as the US winter storm Uri in the first quarter. In addition, large man-made losses amounted to USD 272 million year to date.
The combined ratio significantly improved to 97.5% for the first nine months of 2021 from 110.3% in the same period last year. On a normalised1 basis, P&C Re achieved a combined ratio of 94.0% and is well on track to meet its target of less than 95% for the full year.
View Full Press Release
Capital Product Partners L.P. Quadruples its Second Quarter Net Income on Strong Container Market
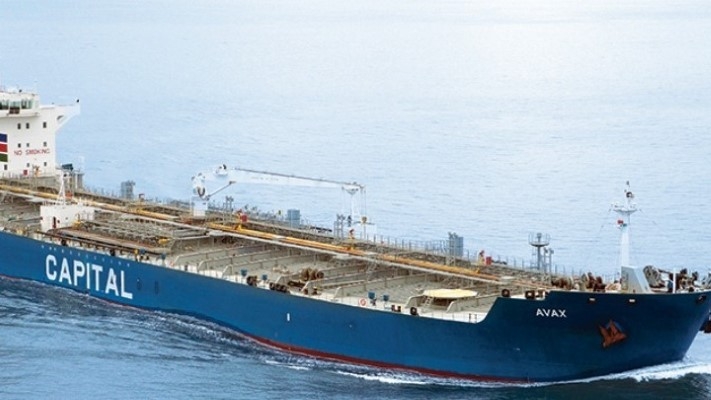
Capital Product Partners L.P., an international owner of ocean-going vessels, released its financial results for the second quarter ended June 30, 2021.
Overview of Second Quarter 2021 Results
Net income for the quarter ended June 30, 2021 was $35.4 million, compared with net income of $8.7 million for the second quarter of 2020. Net income for the second quarter of 2021 includes a gain on sale of $25.4 million from the sale of the M/V ‘CMA CGM Magdalena’ in May 2021. After taking into account the interest attributable to the general partner, net income per common unit for the quarter ended June 30, 2021 was $1.89 (or $0.53, if the gain from the sale of M/V ‘CMA CGM Magdalena’ is excluded), compared to net income per common unit of $0.46 for the second quarter of 2020.
Total revenue was $39.8 million for the quarter ended June 30, 2021, compared to $36.6 million during the second quarter of 2020. The increase in revenue was primarily attributable to the increase in the size of our fleet following the acquisition of three 5,100 TEU containers in February 2021 and the decrease in the net amortization of time charters acquired together with certain of our vessels. The increase was partly set off by the decrease in the average daily charter rate earned by the vessels in our fleet and the sale of the M/V ‘CMA CGM Magdalena’ in May 2021.
Total expenses for the quarter ended June 30, 2021 were $25.6 million, compared to $22.7 million in the second quarter of 2020. Voyage expenses for the quarter ended June 30, 2021 increased to $2.2 million, compared to $1.3 million in the second quarter of 2020, as one of the vessels in our fleet was employed under voyage charters compared to none during the respective period in 2020. Total vessel operating expenses during the second quarter of 2021 amounted to $11.7 million, compared to $9.0 million during the second quarter of 2020. The increase in vessel operating expenses was mainly due to the increase in the size of our fleet following the acquisition of the three 5,100 TEU container vessels in February 2021, partly offset by the sale of the M/V ‘CMA CGM Magdalena’ in May 2021. Total expenses for the second quarter of 2021 also included vessel depreciation and amortization of $10.1 million, compared to $10.5 million in the second quarter of 2020. The decrease in depreciation and amortization during the second quarter of 2021 was mainly attributable to the classification of the vessels M/V ‘CMA CGM Magdalena’ and M/V ‘Adonis’ as vessels held for sale upon entering into a memorandum of agreement for their sale partly offset by the increase by the acquisition of the three 5,100 TEU container vessels in February 2021. General and administrative expenses for the second quarter of 2021 amounted to $1.7 million as compared to $1.8 million in the second quarter of 2020.
Total other expense, net for the quarter ended June 30, 2021 was $4.2 million compared to $5.3 million for the second quarter of 2020. Total other expense, net includes interest expense and finance costs of $4.2 million for the second quarter of 2021, as compared to $5.2 million for the second quarter of 2020. The decrease in interest expense and finance costs was attributable to the decrease in the LIBOR weighted average interest rate compared to the second quarter of 2020.
Capitalization of the Partnership
As of June 30, 2021, total cash amounted to $112.2 million. Total cash includes restricted cash of $8.0 million which represents the minimum liquidity requirement under our financing arrangements.
As of June 30, 2021, total partners’ capital amounted to $461.7 million, an increase of $39.6 million compared to $422.1 million as of December 31, 2020. The increase reflects net income for the six months ended June 30, 2021 and the amortization associated with the equity incentive plan, partly offset by distributions declared and paid during the period in the total amount of $3.8 million and the repurchase of Partnership’s common units for an aggregate amount of $3.9 million.
As of June 30, 2021, the Partnership’s total debt was $347.6 million, reflecting a decrease of $32.1 million compared to $379.7 million as of December 31, 2020. The decrease is attributable to the sale of the M/V ‘CMA CGM Magdalena’ in May 2021 and the respective debt repayment under the respective financing arrangement in the total amount of $49.6 million and to scheduled principal payments of $18.5 million during the period, partly offset by the sale and lease back transaction for an amount of $30.0 million in aggregate and the sellers’ credit agreement with Capital Maritime & Trading Corp. in the amount of $6.0 million in connection with the acquisition of three 5,100 TEU container vessels in February 2021.
Operating Surplus
Operating surplus for the quarter ended June 30, 2021 amounted to $23.5 million, compared to $24.5 million for the previous quarter ended March 31, 2021 and $25.5 million for the second quarter of 2020. We allocated $8.3 million to the capital reserve for the second quarter of 2021, a decrease of $1.8 million compared to the previous quarter due to the decreased debt amortization resulting from the sale of the M/V ‘CMA CGM Magdalena’ in May 2021. Operating surplus for the quarter ended June 30, 2021, after the quarterly allocation to the capital reserve was $15.2 million.
Sale of the M/V ‘CMA CGM Magdalena’
On May 17, 2021, the Partnership concluded the sale of the M/V ‘CMA CGM Magdalena’ (115,639 dwt / 9,288 TEU, Eco-Flex, Wide Beam Containership built 2016, Daewoo-Mangalia Heavy Industries S.Α.) and the vessel was delivered to its new owners, generating gross proceeds from the sale of approximately $49.4 million after repaying outstanding debt. The Partnership recorded an accounting gain on the sale of the vessel in the amount of $25.4 million. Although the vessel was recognized in the Partnership’s books at an acquisition cost of $88.5 million, the cash consideration paid for the acquisition of the vessel in 2016 was $81.5 million, where the difference represented the value allocated at the time to the specific vessel for resetting the partnership’s Incentive Distribution Rights adjusted by the value of the above market acquired charter.
COVID-19
We continue to monitor the impact of COVID-19 on the Partnership’s financial condition and operations and on the container industry in general. The various travel restrictions, health protocols and changing quarantine regimes in the countries in which we operate have so far translated into, among other things, increased costs and off hire related to crewing, crew rotation and crew related expenses, higher forwarding expenses and longer lead times to delivery, as well as increased dry-docking duration and costs. While it is not always possible to distinguish incremental costs or off-hire associated with the impact of COVID-19 on our operations, we estimate that for the second quarter of 2021, incremental operating and/or voyage costs associated with COVID-19 were approximately $0.2 million.
The actual impact of the COVID-19 pandemic in the longer run, as well as the extent of any measures we take in response to the challenges presented by it, as described in our previous releases, will depend on how the pandemic will continue to develop, the distribution of vaccines, the duration and extent of the restrictive measures that are associated with the pandemic and their further impact on global economy and trade. Currently, the container charter market is benefiting from the impact of COVID-19 on the global trade logistics chain (see also Market Commentary Update below).
Management Commentary
Mr. Jerry Kalogiratos, Chief Executive Officer of our General Partner, commented:
“We are pleased to see the continued strong financial performance of the Partnership during the second quarter of 2021 compared to the same period last year. The improved performance reflects in part the favorable underlying container chartering market dynamics, but importantly also the increased fleet size of the Partnership.
“As previously announced, we have taken advantage of the extraordinary container market to sell two of our container vessels at prices substantially higher than the cash prices paid for these vessels five to six years ago. This gives us an opportunity to pursue our objectives at a grander scale: first, to continue to grow our fleet with modern vessels that provide cash flow visibility, second to continue to return capital to our unitholders and last but not least to set the basis for a fleet renewal program that will help reduce the Partnership’s environmental footprint, as ESG considerations and especially vessel trading emissions come to the forefront in our industry.”
Unit Repurchase Program
On January 25, 2021, the Partnership’s Board of Directors approved a unit repurchase program, providing the Partnership with authorization to repurchase up to $30.0 million of units of the Partnership’s common unit, effective for a period of two years. As of June 30, 2021, the Partnership repurchased 331,214 common units since the launching of the unit repurchase plan on February 19, 2021, at an average cost of $11.65 per unit.
Quarterly Common Unit Cash Distribution
On July 21, 2021, the Board of Directors of the Partnership (the “Board”) declared a cash distribution of $0.10 per common unit for the second quarter of 2021 payable on August 10, 2021 to common unit holders of record on August 3, 2021.
Market Commentary Update
The second quarter of 2021 saw further increases in container charter rates with continuous positive momentum building up beyond the second quarter of 2021. The supply of available vessels continues to be very restricted at this point – especially for panamax size and larger vessels – thus creating upward pressure on rates, while longer charter durations are being offered by charterers in order to incentivize owners to fix. Container volume growth remains high, especially on the transpacific trade, where volumes were up by approximately 45% during the first five months of the year compared to the same period a year ago. Overall, the COVID-19 pandemic continues to induce increased demand for containerized goods and the associated inventory replenishment, while logistics chain bottlenecks continue to persist around the globe further restricting the supply of vessels.
As a result, analysts expect container vessel demand to grow by 6.6% in 2021. At the same time, the strength of the container chartering market resulted in the container vessel orderbook approximately doubling within less than 12 months, standing at around 20% of current fleet TEU capacity by mid-July 2021. As of quarter end, slippage including cancellations of newbuilding container vessels stood at 22.0% in TEU compared to 40% at the end of the second quarter of 2020. Supply growth for 2021 is estimated at 4.5% and it is expected to decrease to 2.6% in 2022 before a heavier delivery schedule in 2023.
View Full Report