
Star Bulk Completed Merger With Eagle Bulk
Star Bulk Carriers Corp., a global shipping company focusing on the transportation of dry bulk cargoes, announced that it has completed its merger with Eagle Bulk Shipping Inc. (“Eagle”).
Under the terms of the merger agreement, each Eagle shareholder received 2.6211 shares of Star Bulk common stock for each share of Eagle common stock owned. Eagle common stock has ceased trading and will no longer be listed on the New York Stock Exchange.
Petros Pappas, Chief Executive Officer of Star Bulk, said, “This is an exciting day for Star Bulk as we bring together our companies and create a global leader in dry bulk shipping. We are moving forward with greater scale, a stronger financial profile and unique technical and commercial capabilities to grow our business, better serve our customers and deliver sustainable value for our shareholders.”
Board and Leadership Team Appointments
In connection with the closing of the merger, Gary Weston has joined the Star Bulk Board of Directors, Bo Westergaard has joined Star Bulk’s new leadership team and Costa Tsoutsoplides will serve as interim Senior Advisor to assist with business integration.
Advisors
Cravath, Swaine & Moore LLP served as legal counsel to Star Bulk. Houlihan Lokey served as financial advisor to Eagle and Akin Gump Strauss Hauer & Feld LLP served as legal counsel to Eagle and Hogan Lovells US LLP served as legal counsel to the Board of Directors of Eagle.
Μεγάλο deal στη ναυτιλία: Συγχωνεύονται Star Bulk και Εagle Bulk

Η Star Bulk Carriers και η Eagle Bulk Shipping ανακοίνωσαν οριστική συμφωνία για συγχώνευση δημιουργώντας ένα σχήμα με κεφαλαιοποίηση περίπου 2,1 δισ. δολαρίων και και δημιουργούν έναν παγκόσμιο ηγέτη στο χύδην ξηρό φορτίο.
Σύμφωνα με τους όρους της συμφωνίας, η οποία εγκρίθηκε ομόφωνα από τα διοικητικά συμβούλια και των δύο εταιρειών, οι μέτοχοι της Eagle θα λάβουν 2,6211 κοινές μετοχές της Star Bulk για κάθε μετοχή της Eagle. Αυτό αντιπροσωπεύει ένα συνολικό τίμημα περίπου 52,60 δολάρια ανά μετοχή, premium 17% με βάση την τιμή κλεισίματος της μετοχής της Eagle στα 44,85 δολάρια στις 8 Δεκεμβρίου 2023. Μετά το κλείσιμο της συναλλαγής, οι μέτοχοι της Star Bulk και της Eagle θα κατέχουν περίπου το 71% και το 29% των μετοχών του νέου σχήματος αντίστοιχα.
Ο Πέτρος Παππάς, Διευθύνων Σύμβουλος της Star Bulk, σχολίασε: «Η συνένωση των Star Bulk και Eagle θα δημιουργήσει έναν παγκόσμιο ηγέτη στη ναυτιλία ξηρού χύδην φορτίου με έναν μεγάλο, διαφοροποιημένο στόλο εξοπλισμένο με scrubber. Μαζί θα επωφεληθούμε από μεγαλύτερη κλίμακα, με 169 πλοία, δημιουργώντας ουσιαστικές συνέργειες και δημιουργώντας ένα ακόμη ισχυρότερο οικονομικό προφίλ. Θα αξιοποιήσουμε τις τεχνικές και εμπορικές δυνατότητες διαχείρισης του στόλου και των δύο εταιρειών για να βελτιστοποιήσουμε την απόδοση, να επιτύχουμε τους στόχους μας για την υγεία, την ασφάλεια και το περιβάλλον και να μεγιστοποιήσουμε τις δυνατότητες κερδών. Με έναν καλά κεφαλαιοποιημένο ισολογισμό, στοχεύουμε να συνεχίσουμε να παρέχουμε ισχυρές αποδόσεις μετρητών στους μετόχους, ενώ επενδύουμε σε τεχνολογίες μείωσης των εκπομπών, καθώς συνεχίζουμε να επιδιώκουμε την ανάπτυξη μακροπρόθεσμα. Ανυπομονούμε να συνεργαστούμε με την ταλαντούχα ομάδα Eagle για την επιτυχή ενσωμάτωση των δύο εταιρειών».
Ο Gary Vogel, Διευθύνων Σύμβουλος της Eagle, δήλωσε: «Είμαστε πολύ ενθουσιασμένοι που ενώνουμε τις δυνάμεις μας με την Star Bulk, ενώνοντας δύο εταιρείες με τις καλύτερες στην κατηγορία τους, τόσο εμπορικά όσο και λειτουργικά. Συγκεντρώνουμε δύο άκρως συμπληρωματικούς οργανισμούς και είμαστε βέβαιοι ότι αυτή η δυναμική συγχώνευση με την Star Bulk θα ξεκλειδώσει σημαντική αξία για τους μετόχους της Eagle, συμπεριλαμβανομένης της ευκαιρίας να συμμετάσχουν στη μακροπρόθεσμη ανοδική πορεία της συνδυασμένης εταιρείας».
Η νέα συνδυασμένη εταιρεία θα είναι η μεγαλύτερη εισηγμένη ναυτιλιακή εταιρία ξηρού χύδην φορτίου στο χρηματιστήριο των ΗΠΑ με στόλο 169 ιδιόκτητων πλοίων, το 97% των οποίων είναι εξοπλισμένα με συστήματα καθαρισμού καυσαερίων («scrubbers»), που κυμαίνονται από Newcastlemax/Capesize έως Supramax/Ultramax. Επίσης, η νέα εταιρεία αναμένεται να έχει συνδυασμένη ρευστότητα σχεδόν 420 εκατομμυρίων δολαρίων και καθαρή μόχλευση περίπου 37%.
Η ενοποιημένη εταιρεία θα διοικείται από την τρέχουσας διοικητική ομάδα της Star Bulk και θα συνδυαστεί με ορισμένα ανώτερα στελέχη της Eagle. Με το κλείσιμο, ο κ. Παππάς θα διατελέσει Διευθύνων Σύμβουλος της ενοποιημένης εταιρείας και ο Σπύρος Καπράλος, νυν Πρόεδρος της Star Bulk, θα διατελέσει Πρόεδρος του ΔΣ. Ένα μέλος του διοικητικού συμβουλίου της Eagle θα ενταχθεί στο ΔΣ της Star Bulk.
Star Bulk successfully completes the second repurchase of 10 million of its common shares from oaktree
Star Bulk Carriers Corp., a global shipping company focusing on the transportation of dry bulk cargoes, today announced that on December 1, 2023, they closed the previously announced repurchase of 10 million of its common shares from Oaktree Shareholders (as defined below and such transaction, the “December Share Repurchase”).
As a result of the closing of the December Share Repurchase, (i) the aggregate ownership of Oaktree Dry Bulk Holding LLC and its affiliated funds (collectively, the “Oaktree Shareholders”) in the Company was reduced from approximately 17.1% of the Company’s outstanding common stock to approximately 7.2% and (ii) the number of directors that the Oaktree Shareholders are entitled to nominate pursuant to the shareholders agreement, dated as of July 11, 2014, among the Company and the Oaktree Shareholders, was reduced from two directors to one director. In connection with the closing of the December Share Repurchase, Katherine Ralph, one of the Oaktree Shareholders’ nominated directors, resigned from the Company’s Board of Directors (the “Board”) on December 1, 2023. The vacancy on the Board created by the resignation of Katherine Ralph will not be filled at this time.
Star Bulk Agrees to Acquire Τhree Dry Bulk Vessels From E.R. Capital Holding
Star Bulk Carriers Corp., a global shipping company focusing on the transportation of dry bulk cargoes announced today that it has entered into a definitive agreement with entities affiliated with E.R. Capital Holding GmbH & Cie. KG (“E.R.” or “Sellers” ) pursuant to which the Company will acquire three (3) cape size dry bulk vessels , namely E.R. BAYONNE, E.R. BUENOS AIRES and E.R. BORNEO (the “Vessels”).
The Vessels are retrofitted with exhaust gas cleaning systems (Scrubbers). Consideration for the acquisition is payable in the form of $39.0 million in cash (“Cash Consideration”) and 2,100,000 common shares of Star Bulk (“Share Consideration”). The transaction was negotiated by the Company on the basis of NAV.
The Company is in advanced discussions with a leading financial institution to finance the Cash Consideration through proceeds of a five-year term loan.
Below are the details of the Vessels to be acquired from E.R.:
# Name Type Yard Country Year Built DWT1 E.R. Bayonne Capesize Hyundai Heavy Ind. South Korea 2010 180,0002 E.R. Borneo Capesize Hyundai Heavy Ind. South Korea 2010 180,0003 E.R. Buenos Aires Capesize Hyundai Heavy Ind. South Korea 2010 180,000Total 540,000
The Vessels are expected to be delivered to the Company by early February 2021 and delivery remains subject to the execution of customary closing conditions.
Star Bulk Carriers Corp. Announces Its 2019 Sustainability Report
Star Bulk Carriers Corp., a global shipping company focusing on the transportation of dry bulk cargoes, announced the publication of its 2019 Sustainability Report (“Report”), developed in accordance with the Global Reporting Initiative Standards (Core Option).
The Report has been published on the Company’s website (www.starbulk.com)
This Report provides a transparent account of the Company’s Sustainability performance, targets and strategy, and applies rigorous global standards for comparability and comprehensiveness. In formulating the Company’s targets and measuring its efforts, Star Bulk draws inspiration and guidance from the United Nations’ Sustainable Development Goals (SDGs). The Report presents the Star Bulk priorities and goals and provides extensive information about the Company’s activities towards sustainable development, including corporate governance, operational excellence, and the ways in which it measures and manages its impact on the environment, its people and society. Highlighting the material issues as these have been identified by the Company’s stakeholders, the Report demonstrates the Company’s ambition to engage its employees, investors, customers, banks and other constituents, in the formulation of its strategy and the reporting of its performance.
Commenting on the publication of the Report, Mr. Petros Pappas, Star Bulk CEO, emphasized:“We remain firmly committed to make Star Bulk a leader in sustainable dry bulk shipping. In addition to our strong economic performance this requires continuous efforts to ensure good governance, a broadening and deepening of our social impact and the protection of the natural environment upon which present and future generations depend.”
Star Bulk Carriers Corp. Optimistic About Dry Bulk Market Fundamentals During Second Half of 2020
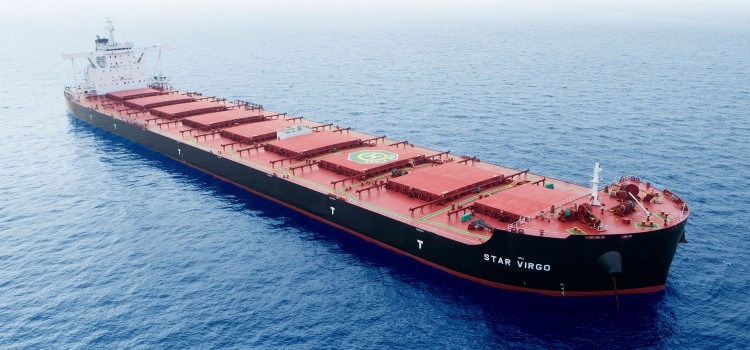
Star Bulk Carriers Corp., a global shipping company focusing on the transportation of dry bulk cargoes, announced its unaudited financial and operating results for the second quarter and the first half of 2020.
Petros Pappas, Chief Executive Officer of Star Bulk, commented:
“Star Bulk announced today its second quarter 2020 financial results, reporting TCE Revenues of $97.1 million, Adjusted EBITDA of $35.1 million, Net loss of $44.1 million and Adjusted Net Loss of $18.1 million during a period of unprecedented volatility. Our average TCE for the quarter, decreased to $9,402/ day per vessel, while daily Opex and Net Cash G&A expenses per vessel were $4,027/day and $1,048/day respectively. As of today, we have physical coverage of 60% of Q3 2020 days at an average TCE rate of $12,145/ day.
We continue taking proactive steps to strengthen our balance sheet via refinancings that improve our Company’s liquidity. Despite the challenging market conditions, there has been significant interest from our lenders to engage with Star Bulk in new transactions. To date we have completed transactions that have increased our cash balance by $37.4 million and have received credit committee approval for another $75.0 million of expected net proceeds that will be finalized over the next two months.
We are optimistic about market fundamentals for the remainder of the year. There is a record low orderbook as a result of recent demand shocks and the uncertainty related to future decarbonization regulations. Dry bulk trade and ton-miles are expected to recover, propelled by the global infrastructure stimulus response to Covid19, which, we expect, will lead to a better balanced dry bulk market“
Recent Developments
Financing Activities
In July 2020, we drew down $155.3 million in aggregate under the (i) ING $70.0 million Facility, (ii) Alpha Bank $35.0 million Facility and (iii) Piraeus Bank $50.4 million Facility, and used this amount to refinance the outstanding amounts under the loan and lease agreements of 14 vessels. The above facilities refinanced facilities with aggregate outstanding amounts of $124.9 million.
In July 2020, we entered into a loan agreement with a wholly owned subsidiary of NTT Finance Corporation for an amount of $17.6 million (the “NTT $17.6 million Facility”). The drawn amount was used to refinance the outstanding lease agreement of the M/V Star Calypso. The facility will mature 5 years from the drawdown date. The NTT $17.6 million Facility is secured by a first priority mortgage on M/V Star Calypso. The above facility refinanced another facility with an outstanding amount of $10.7 million.
In July 2020, we signed a commitment letter with CMBL to sell and leaseback the vessels M/V Laura, M/V Idee Fixe, M/V Roberta, M/V Kaley, M/V Diva, M/V Star Sirius and M/V Star Vega. We expect to receive $89.0 million in aggregate, pursuant to the seven sale and leaseback agreements, which will refinance the outstanding amounts under the loan and lease agreements of the aforementioned vessels. The sale and leaseback agreements are expected to be concluded by the end of August and the lease terms will be for 5 years with a purchase option at the expiration of the bareboat charters term.
In July 2020, we signed a commitment letter with a Japanese financial institution to sell and leaseback the vessel M/V Star Lutas. We expect to receive $16.0 million pursuant to the sale and leaseback agreement, which will refinance the outstanding amount under the loan agreement of the vessel. The sale and leaseback agreement is expected to be concluded by the end of September 2020 and the lease term will be for 7 years with a purchase obligation at the expiration of the bareboat charter term.
In July 2020, we signed a commitment letter with a Chinese financial institution to sell and leaseback three of our Newcastlemax vessels. We expect to receive up to $92.6 million in aggregate, pursuant to the three sale and leaseback agreements, which will refinance the outstanding amount under the loan agreement of the three vessels. The sale and leaseback agreements are expected to be concluded in September 2020 and the lease terms will be for 10 years with a purchase obligation at the expiration of the bareboat charters term.
In July 2020, we signed a commitment letter with SPDB Financial Leasing Co. Ltd to sell and leaseback the vessels M/V Mackenzie, M/V Kennadi, M/V Honey Badger, M/V Wolverine and M/V Star Antares. We expect to receive up to $76.5 million in aggregate, pursuant to the five sale and leaseback agreements, which will refinance the outstanding amount under the loan agreement of the five vessels. The sale and leaseback agreements are expected to be concluded in September 2020 and the lease terms will be for 8 years with a purchase obligation at the expiration of the bareboat charters term.
Should we be able to draw down the full amounts under the above-mentioned debt refinancing transactions, we expect to increase our cash balance further by an aggregate of approximately $75.0 million.
During the second quarter of 2020, we drew down a net amount of $5.4 million under the HSBC Working Capital Facility. As of the date of this press release, $29.6 million is outstanding under this facility.
Scrubber Financing Activities
During the second quarter of 2020 and July 2020, we drew down $15.0 million of scrubber financing under the lease agreements with CMBL. As of today we have completed all scrubber related drawdowns and our scrubber financing balance stands at $118.6 million.
Interest rate derivative contractsAs of the date of this press release, we have agreed to fix the floating LIBOR related component of our interest cost on approximately 66% of our outstanding balance of vessel financings at an average 3-month USD LIBOR rate of 46bps and with an average remaining duration of 3.8 years.
Hedging VLSFO-HSFO spreadAs of the date of this press release, we have hedged approximately 71,000 metric tons of our estimated fuel consumption for the second half of 2020 by selling the 2020 Singapore spread between Very Low-Sulfur Fuel Oil (VLSFO) – High-Sulfur Fuel Oil (HSFO) at an average price of $232 per ton. In addition we have hedged approximately 24,000 metric tons of our estimated fuel consumption by selling the 2021 Singapore spread between VLSFO –HSFO at an average price of $106 per ton.
Other DevelopmentsOn June 4, 2020, the Oslo BORS (“OSE”) granted our request for delisting our shares from the OSE. Our common shares were last listed on the OSE on July 31, 2020 and were delisted on August 3, 2020.
Impact of COVID-19 and our proactive measuresWhile it is still early to fully assess the impact of COVID-19 on our financial condition and operations and on the dry bulk industry in general, we have identified the following adverse effects of the COVID-19 pandemic on our business:
Significant reduction in market charter rates, as a result of the decreased demand for dry bulk commodities and the uncertainty with regard to the timing of a return to more normalized global trade patterns.
Potential adverse impact on asset values reflecting the weaker freight markets environment and lack of liquidity in the second hand market. Star Bulk is fully compliant with all its financial covenants as of end of the first half of 2020.
Significant delays and increased cost associated with crew testing positive on COVID-19, crew rotation, supplying our vessels with spares or other supplies and overhauling or maintenance by attending engineers has been adversely affected by COVID-19 due to travel restrictions and quarantine rules.
The Company has taken proactive measures to ensure the health and wellness of crew and onshore employees while maintaining effective business continuity and the uninterrupted service to our customers.
Our business continuity plans onshore for our global offices in Athens, Limassol, Singapore, New York, Oslo and Manilla, have allowed for an efficient transition to a remote working environment. Additionally, we have also placed a temporary ban on all non-essential travel.
The actual impact of these effects and the efficacy of any measures we take in response to the challenges presented by the COVID-19 will depend on how the outbreak will develop, the duration and extent of the restrictive measures that are associated with COVID-19 and their impact on global economy and trade
Employment Overview
Daily Time Charter Equivalent Rate (“TCE”) and TCE Revenues are non-GAAP measures. Please see the table at the end of this release for a reconciliation to Voyage Revenues, which is the most directly comparable financial measure calculated and presented in accordance with U.S. GAAP, as well as for the definition of the respective measures.
For the second quarter of 2020 our TCE rate was:Capesize / Newcastlemax Vessels: $11,363 per day.Post Panamax / Kamsarmax / Panamax Vessels: $9,703 per day.Ultramax / Supramax Vessels: $6,921 per day.
For first half of 2020 our TCE rate was:Capesize / Newcastlemax Vessels: $13,902 per day.Post Panamax / Kamsarmax / Panamax Vessels: $9,079 per day.Ultramax / Supramax Vessels: $7,501 per day.
Amounts shown throughout the press release and variations in period–on–period comparisons are derived from the actual unaudited numbers in our books and records.
Second Quarter 2020 and 2019 Results
Voyage revenues for the second quarter of 2020 decreased to $146.1 million from $157.8 million in the second quarter of 2019. Adjusted time charter equivalent revenues (“Adjusted TCE Revenues”) (please see the table at the end of this release for the calculation of the Adjusted TCE Revenues) were $96.9 million for the second quarter of 2020, compared to $92.1 million for the second quarter of 2019. Adjusted TCE Revenues were positively impacted by an increase in realized gain on forward freight agreements and bunker swaps of $16.0 million in the second quarter of 2020 from $3.1 million in the second quarter of 2019. However, the negative impact of COVID-19 led to an overall weak dry bulk market environment, which is reflected in the lower TCE rate for the second quarter of 2020 of $9,402 compared to $10,549 for the second quarter of 2019.
For the second quarter of 2020, operating loss was $26.2 million, which includes depreciation of $35.3 million compared to operating loss of $18.4 million for the second quarter of 2019, which included depreciation of $30.0 million. Depreciation increased during the second quarter of 2020 due to the increase in the average number of vessels to 116.0 from 107.2 for the second quarter of 2019 as well as due to the increase in the cost base of our vessels due to the recent installation of scrubber equipment and ballast water management systems on 114 vessels.
For the second quarter of 2020, we had a net loss of $44.1 million, or $0.46 loss per share, basic and diluted, based on 95,797,142 weighted average basic and diluted shares. Net loss for the second quarter of 2019 was $40.2 million, or $0.44 loss per share, basic and diluted, based on 91,841,090 weighted average basic and diluted shares.
Net loss for the second quarter of 2020, included the following significant non-cash items, in addition to the depreciation expense mentioned above:
Stock-based compensation expense of $2.1 million, or $0.02 per share, basic and diluted, recognized in connection with common shares granted to our directors and employees; and
Unrealized loss on forward freight agreements and bunker swaps of $24.1 million, or $0.25 per share, basic and diluted.
Net loss for the second quarter of 2019, included the following significant non-cash items, in addition to the depreciation expense mentioned above:
Stock-based compensation expense of $2.6 million, or $0.03 per share, basic and diluted, recognized in connection with common shares granted to our directors and employees;
Unrealized loss on forward freight agreements and bunker swaps of $4.1 million or $0.04 per share, basic and diluted;
Impairment loss of $3.4 million, or $0.04 per share, basic and diluted, recognized in connection with the agreements signed to sell the vessels Star Anna and Star Gamma;
Loss on bad debt of $1.3 million or $0.01 per basic and diluted share associated with the write‐off of disputed charterer balances; and
Net amortization of the fair value of below and above market acquired time charters of $0.5 million, or $0.01 per share, basic and diluted, associated with time charters attached to vessels acquired. The respective net amortization was recorded as an increase to voyage revenues.
Adjusted net loss for the second quarter of 2020, which excludes certain non-cash items, was $18.1 million, or $0.19 loss per share, basic and diluted, compared to an adjusted net loss for the second quarter of 2019 of $20.5 million, or $0.22 loss per share, basic and diluted.Adjusted EBITDA for the second quarter of 2020, which excludes certain non-cash items was $35.1 million, compared to adjusted EBITDA for the second quarter of 2019 of $31.2 million.For the second quarters of 2020 and 2019, vessel operating expenses were $42.5 million and $39.1 million, respectively. This increase is attributable to the increase in the average number of vessels to 116.0 from 107.2. Our average daily operating expenses per vessel for the second quarter of 2020 and 2019, were $4,027 and $4,004, respectively.
During the second quarter of 2020, we incurred $7.5 million dry docking expenses mainly attributable to nine of our vessels that completed their periodic dry docking surveys within such period. During the second quarter of 2019, we incurred dry docking expenses of $19.0 million mainly attributable to ten of our vessels that completed their periodic dry docking surveys during such period (four of which had commenced in the first quarter of 2019), resulting in expenses of $7.0 million while the remaining $12.0 million were incurred in connection with in-progress and upcoming dry dockings.
General and administrative expenses for the second quarters of 2020 and 2019 were $9.0 million and $9.8 million, respectively. The decrease is mainly attributable to the decrease in stock based compensation expense to $2.1 million in the second quarter of 2020 from $2.6 million in the second quarter of 2019. Management fees for the second quarters of 2020 and 2019 were $4.6 million and $4.1 million, respectively. The increase is attributable to the new management agreements entered into in 2019 in connection with the fleet we acquired during the third quarter of 2019. Our average daily net cash general and administrative expenses per vessel (including management fees) for the second quarters of 2020 and 2019 were $1,048 and $1,009, respectively. Charter-in hire expense for the second quarters of 2020 and 2019 was $5.3 million and $21.8 million, respectively. This decrease is attributable to significantly fewer charter-in days of 360 during the second quarter of 2020 compared to 1,468 days during the second quarter of 2019.
For the second quarter of 2020, we incurred a net loss on forward freight agreements and bunker swaps of $8.1 million, consisting of $16.0 million of realized gain and $24.1 million of unrealized loss. For the second quarter of 2019 we incurred a net loss on forward freight agreements and bunker swaps of $1.0 million, consisting of realized gain of $3.1 million and unrealized loss of $4.1 million.
Interest and finance costs net of interest and other income/(loss) for the second quarters of 2020 and 2019 were $17.8 million and $21.0 million, respectively. Despite the increase in the weighted average balance of our outstanding indebtedness of $1,601.4 million during the second quarter of 2020, compared to $1,474.6 million for the same period in 2019, the interest and finance costs net of interest and other income/ (loss) decreased due to the decrease in the average interest rate on our outstanding indebtedness, mainly driven by the refinancing of certain of our debt agreements, the swap agreements that we entered during the second quarter of 2020 and the lower LIBOR rates during the second quarter of 2020.
First half 2020 and 2019 Results
Voyage revenues for the first half of 2020 decreased to $307.0 million from $324.3 million in the first half of 2019. Adjusted TCE Revenues were $196.7 million for the first half of 2020, compared to $195.7 million for the first half of 2019. Adjusted TCE Revenues were positively impacted by an increase in realized gain on forward freight agreements and bunker swaps of $19.6 million in the first half of 2020 compared to a realized gain of $8.4 million in the first half of 2019, partially counterbalancing the negative impact of COVID-19 in the dry bulk market. As a result, the TCE rate for the first half of 2020 was $10,128 compared to $10,880 for the first half of 2019.
For the first half of 2020, operating loss was $2.8 million, which includes depreciation of $70.0 million while for the first half of 2019, operating loss was $1.2 million, which includes depreciation of $59.8 million. Depreciation increased during the first half of 2020 due to the increase in the average number of vessels in our fleet to 116.0 from 107.2..
For the first half of 2020 we had a net loss of $41.4 million, or $0.43 loss per share, basic and diluted, based on 95,797,142 weighted average basic and diluted shares, while for the first half of 2019 we had a net loss of $45.5 million, or $0.49 loss per share, basic and diluted, based on 92,457,415 weighted average basic and diluted shares.
Net loss for the first half of 2020, included the following significant non-cash items, in addition to depreciation expense mentioned above:
Stock-based compensation expense of $1.2 million, or $0.01 per share, basic and diluted, recognized in connection with common shares granted to our directors and employees, which includes a reversal of previously recognized cost of $1.2 million following the reassessment of the probability of achieving the performance conditions for some of our awards;
Amortization of the fair value of below-market acquired time charters of $0.7 million, or $0.01 per share, basic and diluted, associated with time charters attached to vessels acquired. The respective amortization was recorded as an increase to voyage revenues; and
Loss on debt extinguishment of $0.5 million or $0.01 per share, basic and diluted, recognized in connection with the refinancing of one of our debt facilities.
Net loss for the first half of 2019, included the following significant non-cash items, in addition to depreciation expense mentioned above:
Unrealized loss on forward freight agreements and bunker swaps of $1.0 million or $0.01 per share, basic and diluted;Stock-based compensation expense of $2.9 million, or $0.03 per share, basic and diluted, recognized in connection with common shares granted to our directors and employees;Impairment loss of $3.4 million, or $0.04 per share, basic and diluted, recognized in connection with the agreement to sell the vessels Star Anna and Star Gamma;Loss on bad debt of $1.3 million or $0.01 per basic and diluted share associated with the write‐off of disputed charterer balances; andNet amortization of the fair value of below and above market acquired time charters of $1.2 million, or $0.01 per share, basic and diluted, associated with time charters attached to vessels acquired. The respective net amortization was recorded as an increase to voyage revenues.Adjusted net loss for the first half of 2020, which excludes certain non-cash items, was $40.3 million, or $0.42 loss per share, basic and diluted compared to an adjusted net loss for the first half of 2019 of $26.9 million, or $0.29 loss per share, basic and diluted.
Adjusted EBITDA for the first half of 2020, which excludes certain non-cash items was $67.7 million compared to $77.2 million adjusted EBITDA for the first half of 2019.
For the first half of 2020 and 2019, vessel operating expenses were $85.2 million and $78.1 million, respectively. This increase was attributable to the increase in the average number of vessels to 116.0 from 107.2. Our average daily operating expenses per vessel for the first half of 2020 and 2019, were $4,037 and $4,025, respectively.
During the first half of 2020, we incurred $20.9 million dry docking expenses mainly attributable to 25 of our vessels that completed their periodic dry docking surveys within such period. During the first half of 2019, we incurred dry docking expenses of $28.7 million mainly attributable to 12 of our vessels that completed their periodic dry docking surveys during such period, resulting in expenses of $12.3 million while the remaining $16.4 million were incurred in connection with in-progress and upcoming dry dockings.
General and administrative expenses for the first half of 2020 were $15.0 million compared to $17.1 million during the first half of 2019. The decrease is primarily attributable to the decrease in stock-based compensation expense to $1.2 million in the first half of 2020 from $2.9 million in the first half of 2019 affected also by a reversal of previously recognized cost of $1.2 million following the reassessment of the probability of achieving the performance conditions for some of our awards. Management fees for the first half of 2020 and 2019 were $9.2 million and $8.2 million, respectively. The increase is attributable to the new management agreements entered into in connection with the fleet we acquired during the third quarter of 2019. Our average daily net cash general and administrative expenses per vessel (including management fees) for the first half of 2020 were increased to $1,052 from $990 during the first half of 2019. This increase in daily figures is attributable to the significant decrease in ownership and charter-in days in aggregate during the corresponding periods discussed also below (please see the table at the end of this release for the calculation of the Average daily Net Cash G&A expenses per vessel).
Charter-in hire expense for the first half of 2020 and 2019 was $14.1 million and $44.4 million, respectively. This decrease is attributable to the significant decrease in charter-in days from 3,208 in the first half of 2019 to 726 during the first half of 2020.
For the first half of 2020, we incurred a gain on forward freight agreements and bunker swaps of $19.5 million, consisting of a realized gain of $19.6 million and an unrealized loss of $0.1 million. For the first half of 2019, we incurred a gain on forward freight agreements and bunker swaps of $7.4 million, consisting of a realized gain of $8.4 million and an unrealized loss of $1.0 million.
Interest and finance costs net of interest and other income/ (loss) for the first half of 2020 and 2019 were $37.9 million and $42.7 million, respectively. Despite the increase in the weighted average balance of our outstanding indebtedness to $1,597.3 million during the first half of 2020 from $1,468.4 million during the first half of 2019, the interest and finance costs net of interest and other income/ (loss) decreased due to the decrease in the average interest rate on our outstanding indebtedness, mainly driven by the refinancing of certain of our debt agreements, the swap agreements that we entered during the second quarter of 2020 and the lower LIBOR rates during the first half of 2020.
Liquidity and Capital Resources
Cash Flows
Net cash provided by operating activities for the first half of 2020 and 2019 was $55.5 million and $7.6 million, respectively.
Despite the decrease in Adjusted EBITDA to $67.7 million during the first half of 2020 from $77.2 million during the corresponding period in 2019, our cash provided by operating activities increased in 2020 compared to 2019 due to (i) a net working capital inflow of $22.1 million compared to a net working capital outflow of $19.1 million during the first half of 2019 and (ii) lower net interest expense for the first half of 2020 compared to the corresponding period in 2019.
Net cash used in investing activities for the first half of 2020 and 2019 was $48.2 million and $132.1 million.
For the first half of 2020, net cash used in investing activities consisted of $51.3 million paid in connection with the acquisition and installation of scrubber equipment and ballast water management systems for certain of our vessels, offset partially by insurance proceeds of $3.1 million.
For the first half of 2019, net cash used in investing activities mainly consisted of (i) $93.2 million paid in connection with our newbuilding and newly acquired vessels and other capitalized expenses and (ii) $64.6 million paid for the acquisition and installation of scrubber equipment and ballast water management systems for certain of our vessels, offset partially by proceeds from the sale of three vessels concluded during the period of $20.0 million and insurance proceeds of $5.7 million.
During the first half of 2020 net cash used in financing activities was $25.9 million while during the first half of 2019 net cash provided by financing activities was $7.0 million.
For the first half of 2020, net cash used in financing activities mainly consisted of:
$149.1 million of proceeds from loan and lease financings including $53.8 million drawn under the HSBC Working Capital Facility;
offset by:
$93.4 million lease and debt repayments in connection with the regular amortization of outstanding vessel financings, $24.2 million repayment under the HSBC Working Capital Facility and $51.6 million early repayment due to the refinancing of certain of our finance agreements;
$0.9 million of financing fees paid in connection with the new financing agreements; and
$4.8 million of dividends paid in March 2020 for the fourth quarter of 2019.
For the first half of 2019, net cash provided by financing activities mainly consisted of:
$392.4 million of proceeds from financing including financing from leases;
offset by:
$366.1 million lease and debt obligations paid in aggregate in connection with: (i) the regular amortization of outstanding vessel financings and finance lease installments, and (ii) early repayment due to the refinancing of certain of our finance agreements and the sale of three of our vessels;
$11.6 million used to repurchase our common shares in open market transactions;
$6.2 million of financing fees paid in connection with the new financing agreements; and
$1.5 million of prepayment fees paid in connection with early repaid debt.
Star Bulk Announces Changes to Its Board of Directors
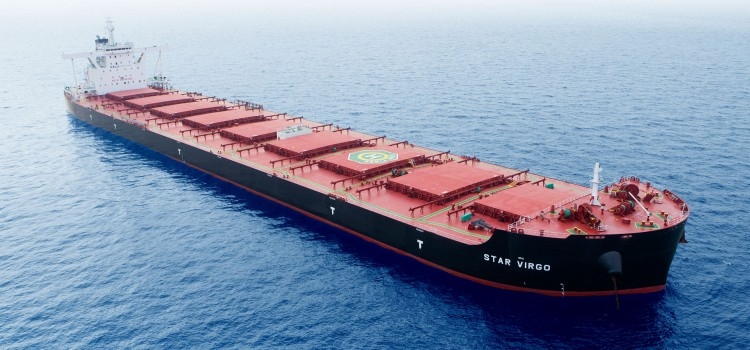
Star Bulk Carriers Corp. yesterday announced the appointment of Mr. Brian Laibow to its Board of Directors (“Board”) as Class B Director and to the Company’s Nomination and Corporate Governance Committee (the “Committee”).
Mr. Laibow fills the seat made vacant by the resignation of Ms. Emily Stephens who had been a director of the Company and member of its Committee since November 2018. Additionally, the Company announced that funds managed by Oaktree Capital Management, L.P. (“Oaktree”) exercised the right to designate an additional director to the Company’s Board under the Oaktree Shareholders Agreement of July 2014.
Oaktree nominated Ms. Dawna Men as its third Board member designee, who will also be a Class B director. Mr. Laibow and Ms. Men are employed by Oaktree. The Board of Directors is now comprised of ten directors.
Star Bulk Carriers Corp. Reports $5.8 Million Net Profit for the Third Quarter 2019
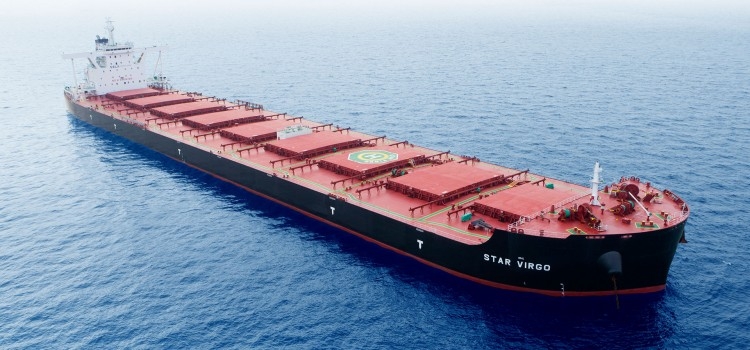
Star Bulk Carriers Corp., a global shipping company focusing on the transportation of dry bulk cargoes, announced its unaudited financial and operating results for the third quarter and the nine months ended September 30, 2019.
Petros Pappas, Chief Executive Officer of Star Bulk, commented:
“Star Bulk returned to profitability during the third quarter 2019, reporting TCE Revenues of $131.3 million, Adjusted EBITDA of $72.2 million and a Net Profit of $5.8 million. The average TCE increased to $14,688/ day per vessel despite our fleet being affected by the repositioning to the Pacific due to our scrubber installation program. Daily Opex and Net Cash G&A expenses per vessel were reduced to $3,693/day and $828/day respectively.
We continued making significant progress in executing our scrubber retrofit program, having installed 88 towers, 50 of which are certified as of today. We are expecting to complete the certification process for the vast majority of our vessels by the end of the year aiming to realize commercial and operational benefits from the scrubber investment.
On the basis of the above results and our scrubber investment, we are pleased to announce a cash dividend for the quarter of $0.05 per share. We are also establishing a transparent dividend policy, under which the Company will distribute dividends once our cash balance has reached set thresholds. We believe the policy safeguards our strong balance sheet, whilst creating value by returning cash to our shareholders.”
Declaration of Dividend
• The Company’s Board of Directors (the “Board”) declared a quarterly cash dividend of $0.05 per share on November 20, 2019, payable on or about December 16, 2019, to all shareholders of record as of December 2, 2019 (“Record Date”). The ex-dividend date is expected to be November 29, 2019.Dividend Policy
• On November 20, 2019, the Board also established a future dividend policy pursuant to which the Board intends to declare a dividend in each of February, May, August and November in an amount equal to (a) SBLK’s Total Cash Balance minus (b) the product of (i) the Minimum Cash Balance per Vessel and (ii) the Number of Vessels.
• “Total Cash Balance” means (a) the aggregate amount of cash on SBLK’s balance sheet as of the last day of the quarter preceding the relevant dividend declaration date minus (b) any proceeds received by SBLK and its subsidiaries from vessel sales or securities offerings in the last 12 months that have been earmarked for share repurchases, debt prepayment and vessel acquisitions.
• “Minimum Cash Balance per Vessel” means:A. $1.00 million for December 31, 2019;B. $1.15 million for March 31, 2020C. $1.30 million for June 30, 2020D. $1.45 million for September 30, 2020E. $1.60 million for December 31, 2020F. $1.75 million for March 31, 2021G. $1.90 million for June 30, 2021H. $2.10 million for September 30, 2021
• “Number of Vessels” means the total number of vessels owned or leased on a bareboat basis by Star Bulk and its subsidiaries as of the last day of the quarter preceding the relevant dividend declaration date.
• Any future dividends remain subject to approval of our Board each quarter, after its review of our financial performance and will depend upon various factors, including but not limited to the prevailing charter market conditions, capital requirements, limitations under our credit agreements and applicable provisions of Marshall Islands law. There can be no assurance that our Board will declare any dividend in the future.
Recent Developments
Fleet Update
• In October, 2019, we agreed to sell the Star Cosmo, a 2005 built Supramax vessel and the Star Epsilon, a 2001 built Supramax vessel. We expect to deliver both vessels to their new owners by the end of November. The proceeds from these sales, after prepayment of the debt related to the two vessels, are expected to be approximately $6.0 million and we expect to incur a non-cash loss of approximately $4.5 million in the fourth quarter of 2019.Scrubber Update
• During Q3 2019 we have completed the installation of 44 scrubber systems, bringing the total number of scrubbers installed to 78, as of September 30, 2019.
• The Company continues to execute on its plan to install scrubbers on 114 out of 116 vessels in its fleet, having installed a total of 88 scrubbers as of November 20, 2019.Financing Activities
• In October 2019 and November 2019, we drew down an aggregate amount of $106.5 million under the CEXIM $106.5 million Facility, which we entered into in September 2019. The proceeds were used to refinance $101.5 million outstanding under the previous lease agreements of the Katie K, the Debbie H, and the Star Ayesha.
• In September 2019, we entered into a committed term sheet with a major European bank for an amount of up to $30.0 million in order to finance working capital requirements, which remains subject to execution of customary definitive documentation.Scrubber Financing Activities
• We incurred the following indebtedness to finance our scrubber installation program:— On August 12, 2019, we drew down $3.3 million under the Attradius Facility.— In September 2019, we drew down (i) $15.6 million under the DNB $310.0 million Facility, (ii) $1.3 million under the SEB Facility and (iii) $7.6 million under the lease agreements with CMBL.
• Subsequent to September 30, 2019, we drew down (i) another $10.9 million under the DNB $310.0 million Facility, (ii) $1.4 million under the ING Facility and (iii) a further $4.6 million under the lease agreements with CMBL.
• Following these drawdowns, the total drawn amount for scrubber financing is $79.1 million and the remaining available scrubber-related financing under all of our debt and lease agreements is $70.7 million.
Employment update
The below estimated daily TCE rates are provided using the discharge-to-discharge method of accounting, while as per US GAAP we recognize revenues in our books using the load-to-discharge method of accounting. Both methods, recognize the same total TCE revenues over the completion of a voyage, however discharge-to-discharge method recognizes revenues over more days, resulting in lower daily TCE rates. Under the load-to discharge method of accounting, increased ballast days at the end of the quarter will reduce the revenues that can be booked, following the accounting cut-off, in the relevant quarter, resulting in reduced daily TCE rates for the respective period.
As of today, we have fixed employment for approximately 68% of the days in Q4 2019 at average TCE rates of $16,284 per day.
More specifically:
Capesize / Newcastlemax Vessels: approximately 63.7% of Q4 2019 days at $23,599 per day.Post Panamax / Kamsarmax / Panamax Vessels: approximately 68.3% of Q4 2019 days at $14,064 per day.Ultramax / Supramax Vessels: approximately 72.6% of Q4 2019 days at $11,743 per day.Amounts shown throughout the press release and variations in period–on–period comparisons are derived from the actual numbers in our books and records.
Third Quarter 2019 and 2018 Results
Voyage revenues for the third quarter of 2019 increased to $248.4 million from $188.5 million in the third quarter of 2018. Adjusted time charter equivalent revenues (“Adjusted TCE Revenues”) (please see the table at the end of this release for the calculation of the Adjusted TCE Revenues) were $131.0 million for the third quarter of 2019, compared to $129.0 million for the third quarter of 2018. While the average number of vessels in the third quarter of 2019 increased to 116.1 from 98.2 in the third quarter of 2018, the Available days for the third quarter of 2019 were not increased proportionally due to the installation of scrubbers and increased dry docking activity during the third quarter of 2019. The TCE rate for the third quarter of 2019 was $14,688 compared to $14,549 for the third quarter of 2018.
For the third quarter of 2019, operating income was $28.6 million, which includes depreciation of $32.2 million, compared to operating income of $47.5 million for the third quarter of 2018, which included depreciation of $28.8 million. Depreciation increased during the third quarter of 2019 due to a higher average number of vessels in our fleet as described above. Operating income declined in the third quarter of 2019 as compared to the third quarter of 2018, mainly because of higher depreciation expense as well as the significantly higher dry docking expenses also affected by our management’s decision to bring forward to 2019 all the 2020 dry docking services concurrently with the installation of scrubbers in order to avoid any additional off hire days in 2020 due to dry docking.
For the third quarter of 2019, we had a net income of $5.8 million, or $0.06 earnings per share, basic and diluted, based on 94,188,543 weighted average basic shares and 94,276,144 weighted average diluted shares, respectively. Net income for the third quarter of 2018 was $26.1 million, or $0.30 earnings per share, basic and diluted, based on 87,025,267 weighted average basic shares and 87,430,711 weighted average diluted shares, respectively.
Net income for the third quarter of 2019, included the following significant non-cash items, other than depreciation expense mentioned above:
• Unrealized gain on forward freight agreements and bunker swaps of $0.4 million or $0.004 per share, basic and diluted;• Stock-based compensation expense of $3.5 million, or $0.04 per share, basic and diluted, recognized in connection with common shares granted to our directors and employees; and• Net amortization of the fair value of below and above market acquired time charters of $0.3 million, or $0.003 per share, basic and diluted, associated with time charters attached to vessels acquired. The respective net amortization was recorded as an increase to voyage revenues.
Full Report
Star Bulk to Buy Eleven Bulkers from Delphin Shipping
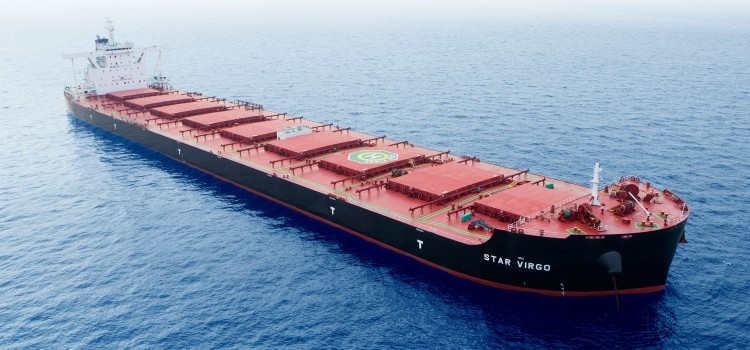
Greek shipping company Star Bulk Carriers has entered into an en bloc definitive agreement to purchase eleven dry bulk vessels from entities controlled by Delphin Shipping.
The units, that were built by Jiangsu Hantong between 2012 and 2014, would be acquired for an aggregate purchase price of USD 139.5 million, payable in the form of USD 80 million in cash and 4.503 million common shares of Star Bulk.
The company said it also secured exhaust gas cleaning systems for all of the vessels “with attractive delivery dates”.
The cash portion would be financed through proceeds of a new seven-year capital lease of up to USD 93.6 million with China Merchants Bank Leasing, and an additional tranche of USD 15 million for financing of scrubbers, thus offering around USD 9 million of additional liquidity for Star Bulk.
Expected to be finalized in June 2019, the acquisition remains subject to the execution of definitive finance agreements and customary closing conditions.
The technical management of the 11 vessels, featuring from 56,600 to 63,100 dwt, would remain with an entity affiliated with Technomar, while commercial management will be taken over by Star Bulk.
If concluded, the transaction would increase Star Bulk’s fleet to 120 vessels.
Source: worldmaritimenews