
Commerzbank still expects net profit of more than €1 billion in 2022 despite additional provisions at mBank
Polish subsidiary books additional provisions for Swiss franc portfolio of the equivalent of €490 millionOperating result of Commerzbank in Q3 to be impacted by corresponding amount Bettina Orlopp: “Despite the new burden in Poland, we are maintaining our earnings target for the full year 2022.”
Commerzbank continues to expect a net result of more than €1 billion for the financial year 2022, despite a further revenue burden at its Polish subsidiary mBank. The outlook remains under the assumption that the economic consequences of the geopolitical developments do not deteriorate significantly and the uncertainties around energy supply do not require material additional provisions for potential future credit losses.
mBank had previously announced that it has booked further additional provisions for its Swiss franc portfolio of PLN2.336 billion (approximately €490 million) as a result of the announced model review. The total provisions for credit agreements indexed on foreign currencies now amount to around €1.43 billion. The additional provisions will have a corresponding negative impact on Commerzbank’s results in the third quarter which will be booked as negative revenues in “Other net income”. mBank also announced a new settlement programme to reach individual agreements with customers.
The new burden adds to the negative revenues which were already announced for the third quarter in July this year due to possible deferrals of interest and repayment of private real estate financing (“payment holidays”) introduced in Poland by the legislation. Nevertheless, Commerzbank expects a positive operating result for the third quarter for the Group as long as the uncertainties about energy supply do not require a further significant risk provisioning.
“Despite the new burden in Poland, we are maintaining our earnings target for the full year 2022 in view of the strong overall revenue development,” said Bettina Orlopp, Chief Financial Officer of Commerzbank. “With the additional provision, mBank has further scope for settlements in its Swiss franc portfolio.”
Star Bulk Carriers Corp. Reports Net Profit of $300.2 Million for the Fourth Quarter of 2021 and Declares Quarterly Dividend of $2.00 Per Share
Star Bulk Carriers Corp., a global shipping company focusing on the transportation of dry bulk cargoes, announced its unaudited financial and operating results for the fourth quarter of 2021. Unless otherwise indicated or unless the context requires otherwise, all references in this press release to “we,” “us,” “our,” or similar references, mean Star Bulk Carriers Corp. and, where applicable, its consolidated subsidiaries.
Petros Pappas, Chief Executive Officer of Star Bulk, commented:
“The favorable market conditions during 2021, enabled the Company to reach record–high profitability. During the fourth quarter, Star Bulk earned net income of $300.2 million, TCE Revenues of $428.0 million and EBITDA of $353.1 million with TCE for the quarter increasing to $37,406/day per vessel. On a full year basis, we managed to have our best year ever, with net income of $680.5 million and EBITDA of $892.0 million.
The increased cash flow from operations helped us further strengthen our balance sheet reaching a current cash balance of $593.7 million, reducing our net debt to $938.8 million. We continue to be committed to our policy of increased shareholder returns, announcing a dividend of $2.00 per share for the fourth quarter. For the full year 2021, Star Bulk will have made total distributions to its shareholders of $4.25 per share, demonstrating its ability to take advantage of strong market conditions and pay meaningful returns to its shareholders.
On the ESG front, Star Bulk has participated in the Carbon Disclosure Project (“CDP”) for the 2021 disclosure cycle and has managed to achieve a “Management” level score (B-), the highest score achieved amongst US listed dry bulk companies.
We remain optimistic about the prospects of the dry bulk markets due to promising supply and demand balance for the coming years. Upcoming environmental regulations and continued global economic growth create a favorable picture for the future of the industry. Star Bulk, has built a solid platform and remains well positioned to take advantage of such continued positive dynamics and reward its shareholders over the long term.”
Recent Developments
Declaration of DividendAs of December 31, 2021, we owned 128 vessels and our Total Cash Balance was $473.3 million. Taking into account the Minimum Cash Balance per Vessel as of December 31, 2021 of $2.10 million, on February 16, 2022, pursuant to our dividend policy, our Board of Directors declared a quarterly cash dividend of $2.00 per share payable on or about March 15, 2022 to all shareholders of record as of March 2, 2022. The ex-dividend date is expected to be March 1, 2022.
Shares Outstanding UpdateAs of February 16, 2022, we have not sold any common shares under either of our effective at-the-market programs and our number of outstanding shares is 102,294,758.
Vessel Employment Overview
Daily Time Charter Equivalent Rate (“TCE”) is a non-GAAP measure. Please see the table at the end of this release for a reconciliation to Voyage Revenues, which is the most directly comparable financial measure calculated and presented in accordance with U.S. GAAP.
For the fourth quarter of 2021 our TCE rate was:Capesize / Newcastlemax Vessels: $47,219 per day.Post Panamax / Kamsarmax / Panamax Vessels: $31,763 per day.Ultramax / Supramax Vessels: $34,024 per day.
For the year ended December, 2021 our TCE rate was:Capesize / Newcastlemax Vessels: $32,286 per day.Post Panamax / Kamsarmax / Panamax Vessels: $24,860 per day.Ultramax / Supramax Vessels: $23,752 per day.
Amounts shown throughout the press release and variations in period–on–period comparisons are derived from the actual unaudited numbers in our books and records. Reference to per share figures below are based on 102,285,188 and 96,983,233 weighted average diluted shares for the fourth quarter of 2021 and 2020, respectively.
Fourth Quarter 2021 and 2020 Results
For the fourth quarter of 2021, we had a net income of $300.2 million, or $2.93 earnings per share, compared to a net income for the fourth quarter of 2020 of $27.8 million, or $0.29 earnings per share.
Adjusted net income, which excludes certain non-cash items, was $302.4 million, or $2.96 earnings per share, for the fourth quarter of 2021, compared to an adjusted net income for the fourth quarter of 2020 of $29.5 million, or $0.30 earnings per share.
Net cash provided by operating activities for the fourth quarter of 2021 was $296.4 million, compared to $58.1 million for the fourth quarter of 2020. Adjusted EBITDA, which excludes certain non-cash items, was $355.1 million for the fourth quarter of 2021, compared to $81.5 million for the fourth quarter of 2020.
Voyage revenues for the fourth quarter of 2021 increased to $499.9 million from $186.0 million in the fourth quarter of 2020 which is indicative of the significantly improved market conditions prevailing during the current period. Time charter equivalent revenues (“TCE Revenues”)1 were $428.0 million for the fourth quarter of 2021, compared to $140.5 million for the fourth quarter of 2020. TCE rate for the fourth quarter of 2021 was $37,406 compared to $13,415 for the fourth quarter of 2020.
For the fourth quarters of 2021 and 2020, vessel operating expenses were $54.2 million and $46.1 million, respectively. Vessel operating expenses for the fourth quarter of 2021 included pre-delivery and pre-joining expenses of $0.1 million and additional crew expenses related to the increased number and cost of crew changes performed during the period as a result of COVID-19 restrictions estimated to be $2.6 million. Vessel operating expenses for the fourth quarter of 2020 included COVID-19 related expenses of $1.6 million. Excluding non-recurring expenses such as pre-delivery and pre-joining expenses and the increased costs due to COVID-19, our daily operating expenses per vessel for the fourth quarters of 2021 and 2020 were $4,373 and $4,169, respectively.
General and administrative expenses for the fourth quarters of 2021 and 2020 were $9.3 million and $7.6 million, respectively and was mainly increased due to the increase of the share-based compensation expense to $1.7 million in the fourth quarter of 2021 from $0.3 million in the corresponding period of 2020. Vessel management fees for the fourth quarters of 2021 and 2020 were $4.9 million and $4.6 million, respectively. Our daily net cash general and administrative expenses per vessel (including management fees and excluding share-based compensation and other non-cash charges) for the fourth quarters of 2021 and 2020 were $1,042 and $1,068, respectively.
Interest and finance costs net of interest and other income/(loss) for the fourth quarters of 2021 and 2020 were $13.1 million and $15.2 million, respectively. This decrease is primarily attributable to the decline in the average interest rate on our outstanding indebtedness, mainly driven by the refinancing of certain of our debt agreements and the redemption of our outstanding 8.30% Senior Notes in July 2021 , the interest rate swap agreements that we entered into in 2020 and 2021 and the lower LIBOR rates during the fourth quarter of 2021 compared to the same period in 2020, as well as the decrease in the weighted average outstanding debt balance during the corresponding periods.
View more
Star Bulk Carriers Corp. Reports Net Profit of $220.4 Million for the Third Quarter Of 2021 and Declares Quarterly Dividend of $1.25 per Share
Star Bulk Carriers Corp., a global shipping company focusing on the transportation of dry bulk cargoes, yesterday announced its unaudited financial and operating results for the third quarter of 2021. Unless otherwise indicated or unless the context requires otherwise, all references in this press release to “we,” “us,” “our,” or similar references, mean Star Bulk Carriers Corp. and, where applicable, its consolidated subsidiaries.
Petros Pappas, Chief Executive Officer of Star Bulk, commented:
“Star Bulk reported a record third quarter, with Net Income of $220.4 million, TCE Revenues of $349.3 million and an improved daily TCE for the fleet of $30,626.
“We continue to generate very healthy operating cashflow, enabling us to strengthen our liquidity position and return cash to our shareholders. As a result of the existing dividend policy, the Company will be paying a dividend of $1.25 / share for the quarter.
“On the sustainability front, we recently published our third annual Environmental, Social, and Governance (ESG) Report which discloses our ESG strategy and performance following rigorous global standards, strengthening our commitment to lead the way in sustainable dry bulk shipping.
“Despite the short term volatility, our overall outlook for the dry bulk market remains constructive. Strong global growth and increased infrastructure spending has led to a healthy rise in demand for commodities which combined with a historically low orderbook, create favorable long term dynamics for our industry.”
Recent Developments
Declaration of Dividend
As of September 30, 2021, we owned 128 vessels and our Total Cash Balance was $371.7 million. Taking into account the Minimum Cash Balance per Vessel as of September 30, 2021 of $1.90 million, on November 16, 2021, pursuant to our dividend policy, our Board of Directors declared a quarterly cash dividend of $1.25 per share payable on or about December 22, 2021 to all shareholders of record as of December 10, 2021. The ex-dividend date is expected to be December 9, 2021.
Financings
During the last three months we have drawn all new senior debt facilities provided by ING Bank N.V., ABN AMRO Bank N.V, DNB Bank ASA and Crédit Agricole Corporate and Investment Bank which refinanced other senior debt facilities as described in our Q2 2021 Press Release. The total proceeds that have been drawn are $306.65 million, $147.50 million of which were drawn up to September 30, 2021 and the remaining $159.15 million were drawn during the period from September 30, 2021 and the date of this release.
Hedging VLSFO – HSFO spread
In November 2021, we hedged 75,000 metric tons of our estimated fuel consumption for the first quarter of 2022 by selling the Singapore spread between Very Low-Sulfur Fuel Oil (VLSFO) and High-Sulfur Fuel Oil (HSFO) at an average price of $134.8 per ton.
ESG Report
In November 2021, we released our third annual Environmental, Social and Governance (ESG) Report which records our ongoing efforts to further strengthen the Company’s environmental stewardship, social contribution and corporate governance, and provides a transparent account of our ESG strategy and performance. The ESG Report was developed in accordance with the Global Reporting Initiative (GRI) Standards (Core Option), the Sustainability Accounting Standards Board (SASB) for Marine Transportation, and the Nasdaq ESG Reporting Guide. Additionally, the GRI and SASB disclosures of the report have been assured by EY’s Climate Change and Sustainability Services. The ESG Report has been published on the Company’s website (www.starbulk.com). The content on our website is not incorporated by reference into this release.
Shares Outstanding Update
During October 2021, we repurchased 466,268 of our common shares in open market transactions at an average price of $22.01 per share for aggregate consideration of $10.3 million, pursuant to the previously announced $50.0 million share repurchase program, all of which were canceled and removed from our share capital as of the date of this release. Following the cancellation of the repurchased shares, our outstanding number of shares is 102,130,024.
As of November 16, 2021, we have not sold any common shares under either of our effective at-the-market programs.
Vessel Employment Overview
For the third quarter of 2021 our TCE rate was:Capesize / Newcastlemax Vessels: $32,258 per day.Post Panamax / Kamsarmax / Panamax Vessels: $30,763 per day.Ultramax / Supramax Vessels: $28,277 per day.
For the first nine months of 2021 our TCE rate was:Capesize / Newcastlemax Vessels: $27,080 per day.Post Panamax / Kamsarmax / Panamax Vessels: $22,442 per day.Ultramax / Supramax Vessels: $20,072 per day.
Amounts shown throughout the press release and variations in period–on–period comparisons are derived from the actual unaudited numbers in our books and records. Reference to per share figures below are based on 102,525,065 and 96,370,925 weighted average diluted shares for the third quarter of 2021 and 2020, respectively.
Third Quarter 2021 and 2020 Results
For the third quarter of 2021, we had a net income of $220.4 million, or $2.15 earnings per share, compared to a net income for the third quarter of 2020 of $23.3 million, or $0.24 earnings per share.
Adjusted net income, which excludes certain non-cash items, was $224.7 million, or $2.19 earnings per share, for the third quarter of 2021, compared to an adjusted net income for the third quarter of 2020 of $27.5 million, or $0.29 earnings per share.
Net cash provided by operating activities for the third quarter of 2021 was $251.0 million, compared to $57.0 million for the third quarter of 2020. Adjusted EBITDA, which excludes certain non-cash items, was $277.8 million for the third quarter of 2021, compared to $79.8 million for the third quarter of 2020.
Voyage revenues for the third quarter of 2021 increased to $415.7 million from $200.2 million in the third quarter of 2020 which is indicative of the improved market conditions prevailing during the current period. Time charter equivalent revenues (“TCE Revenues”)1 were $349.3 million for the third quarter of 2021, compared to $137.6 million for the third quarter of 2020. TCE rate for the third quarter of 2021 was $30,626 compared to $13,084 for the third quarter of 2020.
For the third quarters of 2021 and 2020, vessel operating expenses were $54.1 million and $47.2 million, respectively. Vessel operating expenses for the third quarter of 2021 included pre-delivery and pre-joining expenses of $0.6 million and additional crew expenses related to the increased number and cost of crew changes performed during the period as a result of COVID-19 restrictions estimated to be $2.8 million. Vessel operating expenses for the third quarter of 2020 included COVID-19 related expenses of $1.9 million. Our daily operating expenses per vessel for the third quarters of 2021 and 2020 were $4,596 and $4,425, respectively. Excluding non-recurring expenses such as pre-delivery and pre-joining expenses and the increased costs due to COVID-19, our daily operating expenses per vessel for the third quarters of 2021 and 2020 were $4,304 and $4,244, respectively.
General and administrative expenses for the third quarters of 2021 and 2020 were $12.8 million and $9.3 million, respectively and was mainly increased due to the increase of stock based compensation expense to $6.1 million in the third quarter of 2021 from $3.1 million in the third quarter of 2020. Vessel management fees for the third quarters of 2021 and 2020 were $4.9 million and $4.6 million, respectively. Our daily net cash general and administrative expenses per vessel (including management fees and excluding stock-based compensation and other non-cash charges) for the third quarters of 2021 and 2020 were $987 and $972, respectively.
Interest and finance costs net of interest and other income/(loss) for the third quarters of 2021 and 2020 were $14.8 million and $16.2 million, respectively. This decrease is primarily attributable to the decline in the average interest rate on our outstanding indebtedness, mainly driven by the refinancing of certain of our debt agreements, the interest rate swap agreements that we entered into in 2020 and 2021 and the lower LIBOR rates during the third quarter of 2021 compared to the same period in 2020.
View Full Report
QIC Group’s nine-month net profit jumps 491% to QR511mn
Qatar Insurance Company (QIC) posted a net profit of QR511mn for the first nine months of this year, witnessing a 491% rise compared to the same period in 2020.
The nine-month results the leading insurer in the Middle East North African (MENA) region were announced following a meeting of the Board of Directors, which was presided over by Khalifa Abdulla Turki al-Subaey, chairman and managing director of QIC Group.
Al-Subaey stressed that increasing the return per share (EPS) and effectively contributing to the growth of national economy remains the Group’s first goal. The company’s continuous growth and impressive performance is through successful implementation of the strategy set by the distinguished board of directors in line with Qatar’s 2030 vision under the wise leadership of HH the Amir, Sheikh Tamim bin Hamad al-Thani.
“For the first nine months of 2021, QIC produced solid net results. Our Group quickly returned to an impressive performance, despite the challenges that the Covid-19 pandemic brought to our industry and economies. QIC’s results demonstrate the soundness of our strategy, our focus on low severity products, high management efficiency and operational excellence that rivals the best in our industry,” al-Subaey said. “We are pleased with these results, which were achieved through the successful implementation of the group’s strategic plan that aims to de-risk its international operations, expand its low-volatility activities, diversify its business portfolio and drive forward full fledge digitisation of QIC’s domestic and MENA operations. This achievement is a testament to the strength of our brand,” al-Subaey added.
Chief Executive Officer Salem Khalaf al-Mannai said the Group’s gross written premium for the nine-month period increased by 4% to QR10bn from QR9.6bn for the same period in 2020. International operations profited from hardening of rates and conditions in the international commercial insurance and reinsurance market. In the nine months of 2021, QIC’s international operations – Qatar Re, Antares, QIC Europe Limited (QEL) and our Gibraltar- based carriers – generated premium volume of QR7.9bn, accounting for approximately 79% of the Group’s total gross written premiums (GWP).
QIC once again witnessed a strong performance from its primary insurance business in its domestic and MENA operations, which continued to grow to GWP of QR2.1bn, an increase of 6% compared to the first nine months of 2020 on account of the increase across all major business lines arising from rate increases, new business opportunities and growth in existing accounts.
In 9M, 2021, QIC’s investment income amounted to QR775mn compared to QR369mn for the 9M 2020, demonstrating outstanding asset management capabilities. Antares Syndicate 1274 of Lloyd’s of London specialist re/insurer – Antares Managing Agency Ltd (Antares), wholly owned by QIC Group, was ranked first for 2020 investment performance according to Lloyd’s Peer Analysis by JP Morgan Asset Management, which compares the investment performance of Lloyd’s syndicates with average trust assets of more than £100mn.
Antares received a return on investment of 5.34% for 2020 year-end, compared to a market average of 2.91% and came in second for three-year average returns from 2018 to 2020.
In mid-September, Anoud Technologies (Anoud Tech), a leading provider of software solutions and a wholly-owned subsidiary of QIC Group, was selected by two leading insurers in Europe and the Caribbeans to modernise its IT systems. Anoud Tech developed its fully integrated insurance solution branded Anoud+ in collaboration with Swiss Re.
With Anoud+, insurers have access to a proven end-to-end solution that includes modules for customer relationship management, underwriting, technical accounting, finance, policy and claims management, workflow and document management, business intelligence and reporting, data analytics and reinsurance management. The company was also named by ACORD and Alchemy Crew in the 2020 Top Ten Leaders with the most significant ability to change the industry through technology.
QIC also continued to benefit from its steady efforts to further strengthen its operational efficiency through automation and digitisation with a healthy administrative expense ratio of 6.2%.
Overall, QIC the region’s biggest, most valuable and profitable insurance company in the Middle East according to Forbes Middle East’s annual ranking of top 100 listed companies in the region for 2021, achieved a strong consolidated net profit of QR511mn for 9M 2021 an increase of 491% compared to the same period in 2020.
ABN AMRO reports net profit of EUR 393 million in Q2 2021
Operating performance in line with previous quarters; net impairment release of EUR 79 million
Return on equity of 7.6% in spite of continued pressure on net interest income and incidentals
Society gradually opening up; Dutch economy holding up well as government support continues
Well ahead of plan in CIB non-core wind-down; over 80% reduction, supported by loan disposals
Full-year cost of risk expected to be well below the through-the-cycle guidance of 25-30 bps
Very strong capital position, Basel CET1 ratio of 18.3% (Basel IV around 16%)
Final 2019 dividend of EUR 0.68 per share to be paid in October 2021
Making progress in executing our strategy to be a personal bank in the digital age
Robert Swaak, CEO, comments:
‘Society is gradually opening up as vaccination programmes across Europe are steadily progressing and restrictions are easing. Extensive government support measures have enabled the Dutch economy to hold up relatively well. As a result of the improved macroeconomic outlook we again saw a release of impairments in the second quarter. Demand for corporate loans in the Netherlands is still muted as strong government support continues, but it is showing signs of stabilising and the pipeline is improving.
We are making progress in executing our strategy to be a personal bank in the digital age serving clients where we have scale in the Netherlands and Northwest Europe. We are well ahead of plan in the wind-down of the CIB non-core portfolio which has been reduced by over 80% since Q2 2020, supported by loan disposals. We are focusing on attractive segments where we can grow profitably, bringing convenience into the daily lives of our clients and expertise when it matters. In mortgages we are broadening our intermediary offering by repositioning our online label Moneyou as a competitively priced mortgage provider. Sustainability is core to our purpose and we are making good progress in increasing the volume of sustainable client loans; the target of 21% by 2021 has already been met. We are building a future-proof bank by rigorously simplifying and centralising our operating model, delivering a better experience for our clients. This year we are investing in strengthening our foundation, expanding our digital and data capabilities to enable our new client engagement model. Meanwhile we expect to reduce the current portfolio of around 1,300 products by at least 50% by 2024.
We reported a net profit of EUR 393 million for the second quarter, delivering a 7.6% return on equity (11.1% excluding CIB non-core) in spite of continued pressure on net interest income and incidentals. Operating performance was in line with previous quarters and asset quality is strong. Our mortgage portfolio grew while the corporate loan book for the core bank remained stable. We continued to focus on cost reductions as part of our goal of achieving EUR 700 million in cost savings by 2024. Impairments showed a net release of EUR 79 million for the second quarter as the macroeconomic outlook improved and the wind-down of the CIB non-core portfolio progressed. We expect cost of risk for the bank for 2021 to be well below the through-the-cycle guidance of 25-30 basis points.
Our capital position remains very strong, with a Basel III CET 1 ratio of 18.3% (Basel IV around 16%). As the ECB will not extend its recommendation on dividend distributions beyond September, we will pay the final 2019 dividend of EUR 0.68 per share in October 2021. We are committed to resuming payment of dividend at a ratio of 50% of net profit.’
Star Bulk Carriers Corp. Reports Net Profit of $35.8 Million for the First Quarter of 2021 and Declares Quarterly Dividend of $0.30 Per Share
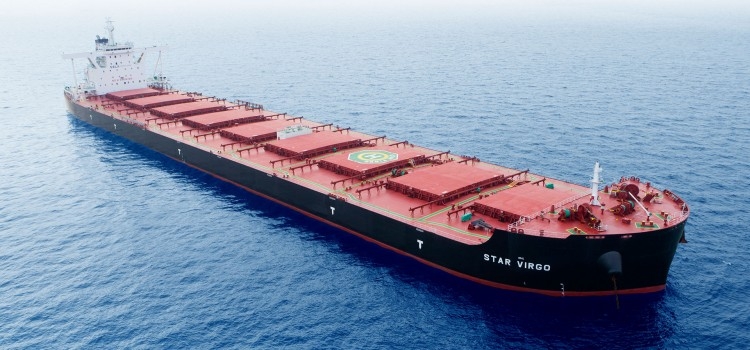
Star Bulk Carriers Corp., a global shipping company focusing on the transportation of dry bulk cargoes, announced its unaudited financial and operating results for the first quarter of 2021. Unless otherwise indicated or unless the context requires otherwise, all references in this press release to “we,” “us,” “our,” or similar references, mean Star Bulk Carriers Corp. and, where applicable, its consolidated subsidiaries.
Petros Pappas, Chief Executive Officer of Star Bulk, commented:
“Star Bulk reported a strong first quarter of 2021, earning net income of $35.8 million, on TCE Revenues of $156.4 million, with daily TCE per vessel for the fleet increasing to $15,461. The majority of the fleet remains exposed to the spot market for Q3 and following, with current forward coverage at $21,168 for 82% of available days in Q2.
The Board of Directors has amended the Company’s dividend policy to substantially increase return of capital to our shareholders. As a result, the Company will be paying a dividend for Q1 of $0.30 / share for the first quarter.
Over the past months we have continued increasing our fleet with the acquisition of twelve vessels, on average younger than our current fleet, nine of which were delivered within Q1. We expect to take delivery of the remaining three vessels during Q2.
Our outlook for the market remains positive due to the reopening of the global economy and consequent increased demand across all key dry bulk commodities. The record low orderbook coupled with upcoming environmental regulations that limit new vessel orders, also create favorable long term dynamics for our industry, which our Company is well positioned to enjoy.”
Recent Developments
Declaration of Dividend
The Company’s Board of Directors (the “Board”) declared a quarterly cash dividend of $0.30 per share on May 19, 2021, payable on or about June 14th, 2021 to all shareholders of record as of May 31st, 2021 (“Record Date”). The ex-dividend date is expected to be May 30th, 2021.Updated Dividend Policy
In November 2019, the Board established a dividend policy, which is now updated, pursuant to which the Board intends to declare a dividend in each of February, May, August and November in an amount equal to (a) Star Bulk’s Total Cash Balance minus (b) the product of (i) the Minimum Cash Balance per Vessel and (ii) the Number of Vessels.“Total Cash Balance” means (a) the aggregate amount of cash on Star Bulk’s balance sheet as of the last day of the quarter preceding the relevant dividend declaration date minus (b) any proceeds received by Star Bulk, including its subsidiaries, from vessel sales, or additional proceeds from vessel refinancings, or securities offerings in the last 12 months that have been earmarked for share repurchases, debt prepayment, vessel acquisitions and general corporate purposes.
“Minimum Cash Balance per Vessel” means:
$1.40 million for March 31, 2021;$1.65 million for June 30, 2021$1.90 million for September 30, 2021$2.10 million for December 31, 2021 and thereafter
“Number of Vessels” means the total number of vessels owned by the Company, including its subsidiaries, or that are subject to sale and leaseback transactions and finance leases, as of the last day of the quarter preceding the relevant dividend declaration date.
As of March 31, 2021, we owned 125 vessels and our Total Cash Balance was at $206.6 million. Adjusted for the Minimum Cash Balance per Vessel for March 31, 2021 of $1.40 million, resulted in total declared dividend amount of approximately $31.0 million or $0.30 per share.
Since Star Bulk is a holding company with no material assets other than the shares of its subsidiaries through which it conducts its operations, Star Bulk’s ability to pay dividends will depend on its subsidiaries distributing their earnings and cash flow to it. Any future dividends declared will be at the discretion and remain subject to approval of our Board each quarter, after its review of our financial condition and other factors, including but not limited to our earnings, prevailing charter market conditions, capital requirements, limitations under our debt agreements and applicable provisions of Marshall Islands law, which generally prohibits the payment of dividends other than from operating surplus or while a company is insolvent or would be rendered insolvent upon the payment of such dividend. Star Bulk’s dividend policy and declaration and payment of dividends may be changed at any time and are subject to legally available funds and the Board’s determination that each declaration and payment is at the time in the best interests of Star Bulk and its shareholders after its review of our financial performance. There can be no assurance that our Board will declare or pay any dividend in the future.
Fleet Update:
On May 19, 2021 we took delivery of SBI Pegasus, the seventh and final vessel, pursuant to the previously announced transaction with ENETI INC (formerly known as Scorpio Bulkers Inc.). We issued to the relevant ENETI affiliates 350,797 common shares representing the share consideration for the seventh vessel and we assumed the outstanding lease obligations associated with the vessel. Following the issuance of these shares the Company has 102,239,716 common shares issued and outstanding.
COVID-19 and Our Proactive Measures
Despite the global gradual recovery from COVID-19, we continue to take proactive measures to ensure the health and wellness of our crew and onshore employees while maintaining effective business continuity and uninterrupted service to our customers. The overall impact of COVID-19 on our business, and the efficacy of any measures we take in response to the challenges presented by the COVID-19 pandemic, will depend on how the outbreak further develops, the duration and extent of the restrictive measures that are associated with the pandemic and their impact on global economy and trade, which is still uncertain.
Employment Overview
Daily Time Charter Equivalent Rate (“TCE”) and TCE Revenues are non-GAAP measures. Please see the table at the end of this release for a reconciliation to Voyage Revenues, which is the most directly comparable financial measure calculated and presented in accordance with U.S. GAAP, as well as for the definition of the respective measures.
*For the first quarter of 2021 our TCE rate was:
Capesize / Newcastlemax Vessels: $17,986 per day.Post Panamax / Kamsarmax / Panamax Vessels: $14,791 per day.Ultramax / Supramax Vessels: $13,632 per day.
Amounts shown throughout the press release and variations in period–on–period comparisons are derived from the actual unaudited numbers in our books and records. Reference to per share figures below are based on 99,019,944 and 95,916,480 weighted average diluted shares for the first quarter of 2021 and 2020, respectively.
First Quarter 2021 and 2020 Results
For the first quarter of 2021, we had a net income of $35.8 million, or $0.36 earnings per share. Net income for the first quarter of 2020 was $2.8 million, or $0.03 earnings per share.
Adjusted net income, which excludes certain non-cash items, was $35.7 million, or $0.36 earnings per share for the first quarter of 2021, compared to an adjusted net loss for the first quarter of 2020 of $22.3 million, or $0.23 loss per share.
Net cash provided by operating activities for the first quarter of 2021 was $79.2 million, compared to net cash provided by operating activities of $32.1 million for the first quarter of 2020. Adjusted EBITDA, which excludes certain non-cash items, was $84.7 million for the first quarter of 2021, compared to adjusted EBITDA of $32.6 million for the first quarter of 2020.
Voyage revenues for the first quarter of 2021 increased to $200.5 million from $160.9 million in the first quarter of 2020. Time charter equivalent revenues (“TCE Revenues”) (please see the table at the end of this release for the calculation of the TCE Revenues) were $156.4 million for the first quarter of 2021, compared to $99.8 million for the first quarter of 2020. TCE rate for the first quarter of 2021 was $15,461 compared to $10,949 for the first quarter of 2020.
For the first quarters of 2021 and 2020, vessel operating expenses were $47.4 million and $42.7 million, respectively. Vessel operating expenses for the first quarter of 2021 included pre-delivery and pre-joining expenses of $0.5 million and additional crew expenses related to the increased number of crew changes performed during the period as a result of COVID-19 restrictions imposed during 2020 of $1.3 million. Our average daily operating expenses per vessel for the first quarters of 2021 and 2020 were $4,410 and $4,047, respectively. Excluding non-recurring expenses such as pre-delivery and pre-joining expenses and the increased costs due to the COVID-19 pandemic in 2021, our average daily operating expenses per vessel for the first quarter of 2021 were $4,251.
General and administrative expenses for the first quarters of 2021 and 2020 were $7.3 million and $6.0 million, respectively. The increase is mainly attributable to the reversal, in the first quarter of 2020, of the previously recognized stock based compensation expense of $1.2 million following the reassessment of the probability of achieving the performance conditions for some of our outstanding awards. Vessel management fees for the first quarters of 2021 and 2020 were $4.7 million and $4.6 million, respectively. Our average daily net cash general and administrative expenses per vessel (including management fees and excluding stock-based compensation and other non-cash charges) for the first quarters of 2021 and 2020 were $1,087 and $1,064, respectively.
Interest and finance costs net of interest and other income/(loss) for the first quarters of 2021 and 2020 were $12.7 million and $20.1 million, respectively. Despite the increase in the weighted average balance of our outstanding indebtedness to $1,604.5 million during the first quarter of 2021, from $1,593.2 million for the same period in 2020, the interest and finance costs net of interest and other income/ (loss) decreased due to the decrease in the average interest rate on our outstanding indebtedness, mainly driven by the refinancing of certain of our debt agreements, the interest rate swap agreements that we entered into in 2020 and 2021 and the lower LIBOR rates during the first quarter of 2021 compared to the same period in 2020.
View Full Report
CNP Assurances – 2020 Annual Results: Attributable net profit of €1,350 million, SCR coverage ratio of 208%, Recommended dividend of €1.57 per share
Premium income(2) of €27.0 billion, down 17.3% as reported (down -11.5% at constant exchange rates(3))- Strong commercial momentum in the second half, across all geographies- 51.8% of Savings/Pensions premiums represented by unit-linked contracts- €5.9 billion net inflow to unit-linked contracts and €7.2 billion net outflow from traditional products at Group level
EBIT of €2,614 million, down 14.0% as reported (down 5.7% at constant exchange rates)
Attributable net profit of €1,350 million, down 4.4% as reported (down 2.1% at constant exchange rates)
APE margin of 12.2%
Consolidated SCR coverage ratio of 208%
The Board of Directors recommends paying a dividend of €1.57 per share, comprising an ordinary dividend of €0.77 and a special dividend of €0.80, representing a 40% payout ratio for the years 2019 and 2020.
Antoine Lissowski, CNP Assurances’ Chief Executive Officer, said:
“In spite of the Covid-19 health crisis which affected Life insurance sales in France in the first half of the year, CNP Assurances began transforming its business and in-force portfolio in response to the negative interest rate environment. Written premiums were particularly strong in Italy and Brazil, where activity is heavily weighted towards unit-linked products.The Group’s financial results and solvency ratio were robust despite the effects of the economic slowdown.Now an integral part of La Banque Postale group, CNP Assurances is fully engaged in the process to reshape its business model.”
(1) Recommended at the Annual General Meeting of 16 April 2021(2) 2019 premium income has been restated to exclude the top line contribution of Fourgous and Eurocroissance transfers for a total of €914 million. (3) Average exchange rates:At 31 December 2020: Brazil: €1 = BRL 5.89; Argentina: €1 = ARS 81.04 At 31 December 2019: Brazil: €1 = BRL 4.41; Argentina: €1 = ARS 53.88
Download .PDF (308.3 kB)
Bahri’s net profit soars 134% in first quarter despite COVID-19 challenges

Bahri, a global leader in logistics and transportation, on Wednesday reported strong growth in net profit during the first quarter of 2020 despite challenges posed by the global COVID-19 pandemic. The increase in quarterly earnings was driven by a significant improvement in the performance of the company’s business units resulting from a rise in freight rates and strong demand for oil transportation.
Bahri’s net profit after zakat and tax for the three months ended March 31, 2020, jumped by a huge 133.77 percent to SAR 419.22 million from SAR 179.33 million recorded in the same period in 2019. The growth also represents a quarter-to-quarter increase of 68.3 percent from SAR 249.08 million.
Total revenue for the quarter under review rose to SAR 2.08 billion, up 22.06 percent from SAR 1.7 billion a year ago, and 7.36 percent from SAR 1.94 billion in the fourth quarter of 2019. Total shareholders’ equity stood at SAR 9.63 billion and profit per share at SAR 1.06.
Commenting on the quarterly results, Abdullah Aldubaikhi, CEO, Bahri, said: “We are extremely pleased to report strong earnings for the first quarter as a result of a remarkable performance delivered by our business units. The results are a testimony to our constant desire and our unmatched capabilities to seize opportunities in the market as they emerge. Our extensive efforts to enhance operational efficiency and improve productivity have also paid off. Despite the COVID-19 pandemic causing unique challenges, we are continuing to operate as normal to support our customers.”
The company’s gross profit stood at SAR 561.33 million, rising 31.71 percent from SAR 426.18 million in Q1 2019 while operating profit went up 34.1 percent from SAR 377.18 million in last year’s January-March period to SAR 505.79 million in the corresponding period this year.
ABN AMRO reports net profit of EUR 2,046 million for FY 2019
ABN AMRO reports net profit of EUR 2,046 million for FY 2019
– Q4 2019 net profit of EUR 316 million, impacted by low interest rates and high impairments- Return on equity for FY 2019 solid at 10.0%; cost/income ratio for FY 2019 of 61%- Basel III capital position strong, CET1 ratio at 18.1% and Basel IV CET1 over 14%- Final dividend of EUR 0.68 per share proposed. FY 2019 dividend pay-out ratio maintained at 62%, which equals EUR 1.28 per share- Progress made on remediation programmes; Detecting Financial Crime (DFC) activities reviewed by independent expert, plan shared with regulator- Costs around EUR 5.1 billion in 2020 and below EUR 5.0 billion thereafter; increasing DFC costs to be mitigated by further IT savings
Kees van Dijkhuizen, CEO, comments:
‘In the past year, we continued to focus on diligent execution of our strategy. At Private Banking, the volume of client assets invested sustainably more than doubled to EUR 19 billion, one year ahead of our target. We strengthened our lead in video banking at Retail Banking and have extended this service to all businesses. Florius’ clients can now increase their mortgages without having to submit documents, provided they give us permission to use source data – simplifying and digitalising the mortgage application process. Our efforts to be a sustainable bank are reflected by our inclusion in the Dow Jones Sustainability Index, which ranks us in the top 10% of most sustainable banks worldwide.
At present, more than 2,000 FTEs are fully committed to DFC, and we are making progress on our remediation programmes and expect to complete these in 2022. Artificial intelligence and robotics are being incorporated to improve effectiveness and efficiency. There is no update on the investigation by the Dutch public prosecutor.
Net profit in Q4 2019 of EUR 316 million was impacted by low interest rates and high loan impairments in specific sectors at Corporate & Institutional Banking (CIB). We will continue to de-risk part of the CIB loan portfolio and will conduct a further review of CIB’s activities. Net profit for 2019 was EUR 2,046 million, resulting in an ROE of 10.0%. Our capital position remains strong at 18.1%, despite material add-ons anticipating TRIM and model reviews. We currently face several regulatory uncertainties and propose maintaining the dividend pay-out stable at 62% and paying a final dividend of EUR 0.68 per share, bringing the FY 2019 dividend proposal to EUR 1.28 per share.
We will continue to focus on costs in the next few years and will reap the benefits from the IT transformation. These cost savings are expected to mitigate increasing DFC costs. We expect costs to be around EUR 5.1 billion in 2020 and to be below EUR 5.0 billion thereafter.’
ABN AMRO Press Release Q4 results 2019
ABN AMRO Bank Quarterly Report 2019 Q4
Star Bulk Carriers Corp. Reports $5.8 Million Net Profit for the Third Quarter 2019
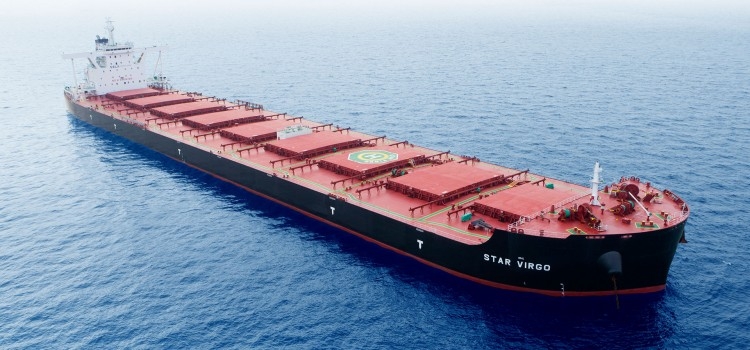
Star Bulk Carriers Corp., a global shipping company focusing on the transportation of dry bulk cargoes, announced its unaudited financial and operating results for the third quarter and the nine months ended September 30, 2019.
Petros Pappas, Chief Executive Officer of Star Bulk, commented:
“Star Bulk returned to profitability during the third quarter 2019, reporting TCE Revenues of $131.3 million, Adjusted EBITDA of $72.2 million and a Net Profit of $5.8 million. The average TCE increased to $14,688/ day per vessel despite our fleet being affected by the repositioning to the Pacific due to our scrubber installation program. Daily Opex and Net Cash G&A expenses per vessel were reduced to $3,693/day and $828/day respectively.
We continued making significant progress in executing our scrubber retrofit program, having installed 88 towers, 50 of which are certified as of today. We are expecting to complete the certification process for the vast majority of our vessels by the end of the year aiming to realize commercial and operational benefits from the scrubber investment.
On the basis of the above results and our scrubber investment, we are pleased to announce a cash dividend for the quarter of $0.05 per share. We are also establishing a transparent dividend policy, under which the Company will distribute dividends once our cash balance has reached set thresholds. We believe the policy safeguards our strong balance sheet, whilst creating value by returning cash to our shareholders.”
Declaration of Dividend
• The Company’s Board of Directors (the “Board”) declared a quarterly cash dividend of $0.05 per share on November 20, 2019, payable on or about December 16, 2019, to all shareholders of record as of December 2, 2019 (“Record Date”). The ex-dividend date is expected to be November 29, 2019.Dividend Policy
• On November 20, 2019, the Board also established a future dividend policy pursuant to which the Board intends to declare a dividend in each of February, May, August and November in an amount equal to (a) SBLK’s Total Cash Balance minus (b) the product of (i) the Minimum Cash Balance per Vessel and (ii) the Number of Vessels.
• “Total Cash Balance” means (a) the aggregate amount of cash on SBLK’s balance sheet as of the last day of the quarter preceding the relevant dividend declaration date minus (b) any proceeds received by SBLK and its subsidiaries from vessel sales or securities offerings in the last 12 months that have been earmarked for share repurchases, debt prepayment and vessel acquisitions.
• “Minimum Cash Balance per Vessel” means:A. $1.00 million for December 31, 2019;B. $1.15 million for March 31, 2020C. $1.30 million for June 30, 2020D. $1.45 million for September 30, 2020E. $1.60 million for December 31, 2020F. $1.75 million for March 31, 2021G. $1.90 million for June 30, 2021H. $2.10 million for September 30, 2021
• “Number of Vessels” means the total number of vessels owned or leased on a bareboat basis by Star Bulk and its subsidiaries as of the last day of the quarter preceding the relevant dividend declaration date.
• Any future dividends remain subject to approval of our Board each quarter, after its review of our financial performance and will depend upon various factors, including but not limited to the prevailing charter market conditions, capital requirements, limitations under our credit agreements and applicable provisions of Marshall Islands law. There can be no assurance that our Board will declare any dividend in the future.
Recent Developments
Fleet Update
• In October, 2019, we agreed to sell the Star Cosmo, a 2005 built Supramax vessel and the Star Epsilon, a 2001 built Supramax vessel. We expect to deliver both vessels to their new owners by the end of November. The proceeds from these sales, after prepayment of the debt related to the two vessels, are expected to be approximately $6.0 million and we expect to incur a non-cash loss of approximately $4.5 million in the fourth quarter of 2019.Scrubber Update
• During Q3 2019 we have completed the installation of 44 scrubber systems, bringing the total number of scrubbers installed to 78, as of September 30, 2019.
• The Company continues to execute on its plan to install scrubbers on 114 out of 116 vessels in its fleet, having installed a total of 88 scrubbers as of November 20, 2019.Financing Activities
• In October 2019 and November 2019, we drew down an aggregate amount of $106.5 million under the CEXIM $106.5 million Facility, which we entered into in September 2019. The proceeds were used to refinance $101.5 million outstanding under the previous lease agreements of the Katie K, the Debbie H, and the Star Ayesha.
• In September 2019, we entered into a committed term sheet with a major European bank for an amount of up to $30.0 million in order to finance working capital requirements, which remains subject to execution of customary definitive documentation.Scrubber Financing Activities
• We incurred the following indebtedness to finance our scrubber installation program:— On August 12, 2019, we drew down $3.3 million under the Attradius Facility.— In September 2019, we drew down (i) $15.6 million under the DNB $310.0 million Facility, (ii) $1.3 million under the SEB Facility and (iii) $7.6 million under the lease agreements with CMBL.
• Subsequent to September 30, 2019, we drew down (i) another $10.9 million under the DNB $310.0 million Facility, (ii) $1.4 million under the ING Facility and (iii) a further $4.6 million under the lease agreements with CMBL.
• Following these drawdowns, the total drawn amount for scrubber financing is $79.1 million and the remaining available scrubber-related financing under all of our debt and lease agreements is $70.7 million.
Employment update
The below estimated daily TCE rates are provided using the discharge-to-discharge method of accounting, while as per US GAAP we recognize revenues in our books using the load-to-discharge method of accounting. Both methods, recognize the same total TCE revenues over the completion of a voyage, however discharge-to-discharge method recognizes revenues over more days, resulting in lower daily TCE rates. Under the load-to discharge method of accounting, increased ballast days at the end of the quarter will reduce the revenues that can be booked, following the accounting cut-off, in the relevant quarter, resulting in reduced daily TCE rates for the respective period.
As of today, we have fixed employment for approximately 68% of the days in Q4 2019 at average TCE rates of $16,284 per day.
More specifically:
Capesize / Newcastlemax Vessels: approximately 63.7% of Q4 2019 days at $23,599 per day.Post Panamax / Kamsarmax / Panamax Vessels: approximately 68.3% of Q4 2019 days at $14,064 per day.Ultramax / Supramax Vessels: approximately 72.6% of Q4 2019 days at $11,743 per day.Amounts shown throughout the press release and variations in period–on–period comparisons are derived from the actual numbers in our books and records.
Third Quarter 2019 and 2018 Results
Voyage revenues for the third quarter of 2019 increased to $248.4 million from $188.5 million in the third quarter of 2018. Adjusted time charter equivalent revenues (“Adjusted TCE Revenues”) (please see the table at the end of this release for the calculation of the Adjusted TCE Revenues) were $131.0 million for the third quarter of 2019, compared to $129.0 million for the third quarter of 2018. While the average number of vessels in the third quarter of 2019 increased to 116.1 from 98.2 in the third quarter of 2018, the Available days for the third quarter of 2019 were not increased proportionally due to the installation of scrubbers and increased dry docking activity during the third quarter of 2019. The TCE rate for the third quarter of 2019 was $14,688 compared to $14,549 for the third quarter of 2018.
For the third quarter of 2019, operating income was $28.6 million, which includes depreciation of $32.2 million, compared to operating income of $47.5 million for the third quarter of 2018, which included depreciation of $28.8 million. Depreciation increased during the third quarter of 2019 due to a higher average number of vessels in our fleet as described above. Operating income declined in the third quarter of 2019 as compared to the third quarter of 2018, mainly because of higher depreciation expense as well as the significantly higher dry docking expenses also affected by our management’s decision to bring forward to 2019 all the 2020 dry docking services concurrently with the installation of scrubbers in order to avoid any additional off hire days in 2020 due to dry docking.
For the third quarter of 2019, we had a net income of $5.8 million, or $0.06 earnings per share, basic and diluted, based on 94,188,543 weighted average basic shares and 94,276,144 weighted average diluted shares, respectively. Net income for the third quarter of 2018 was $26.1 million, or $0.30 earnings per share, basic and diluted, based on 87,025,267 weighted average basic shares and 87,430,711 weighted average diluted shares, respectively.
Net income for the third quarter of 2019, included the following significant non-cash items, other than depreciation expense mentioned above:
• Unrealized gain on forward freight agreements and bunker swaps of $0.4 million or $0.004 per share, basic and diluted;• Stock-based compensation expense of $3.5 million, or $0.04 per share, basic and diluted, recognized in connection with common shares granted to our directors and employees; and• Net amortization of the fair value of below and above market acquired time charters of $0.3 million, or $0.003 per share, basic and diluted, associated with time charters attached to vessels acquired. The respective net amortization was recorded as an increase to voyage revenues.
Full Report