
Hurricanes, severe thunderstorms and floods drive insured losses above USD 100 billion for 5th consecutive year, says Swiss Re Institute

Estimated insured losses from natural catastrophes on track to exceed USD 135 billion in 2024
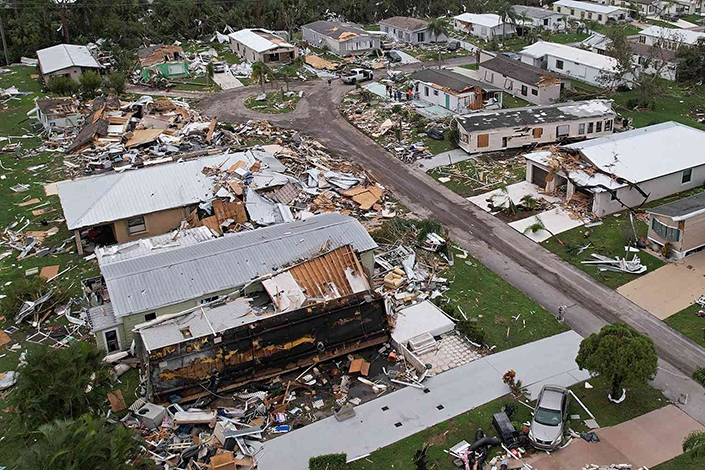
Hurricane Helene and Hurricane Milton severely impacted the US, resulting in estimated insured losses approaching USD 50 billion
Major floods hit Europe and the Middle East, causing estimated insured losses of close to USD 13 billion as of today
With 1.54°C above the pre-industrial average, 2024 is set to become the hottest year on record. A warming climate favours the occurrence of many of the natural catastrophes observed in 2024. Europe, in particular, has experienced intense flooding in 2024, resulting in the second-highest insured losses from floods in the region ever, according to Swiss Re Institute’s estimates. The US has been affected by two major hurricanes and a high frequency of severe thunderstorms, making up at least two thirds of 2024’s global insured losses of more than USD 135 billion as of today’s estimates.
Balz Grollimund, Swiss Re’s Head Catastrophe Perils, says: “For the fifth consecutive year, insured losses from natural catastrophes break the USD-100-billion mark. Much of this increasing loss burden results from value concentration in urban areas, economic growth, and increasing rebuilding costs. By favouring the conditions leading to many of this year’s catastrophes, climate change is also playing an increasing role. This is why investing in mitigation and adaptation measures must become a priority.”
Flood risk is rising globally
In 2024, severe floods in Europe and the UAE resulted in estimated insured losses of close to USD 13 billion to date. It was the third-costliest year for this peril globally and the second costliest for Europe which experienced insured losses of approximately USD 10 billion, according to Swiss Re Institute’s estimates.
Intense precipitation in April caused floods in the Gulf region, disrupting the operations of the world’s busiest airport of Dubai. In September, Storm Boris caused major floods in Central Europe, mainly affecting the Czech Republic, Poland and Austria. Additional impacts were reported from Slovakia, Romania, Italy and Croatia. While so-called Vb lows – slow-moving, low-pressure systems – are nothing unusual in the region, the strong intensity of the Vb system connected to Storm Boris is favoured by conditions related to climate change. Storm Boris mixed cold Arctic air flowing southwards with unusually warm air from the east and south, drawing moisture from a record-breaking warm Mediterranean Sea.
In October, large parts of Spain experienced heavy rainfall, flash floods and hailstorms, which caused severe damage. The floods were worst in eastern and southern Spain, with most of the damage across the Valencia and Castilla-La Mancha regions. Andalusia and the Balearic Islands were also affected. One year’s average precipitation was dumped in less than eight hours in many locations. Steep clay terrain and drainage systems could not absorb the exceptional amount of water, leading to fast overflows.
Pluvial floods can severely affect urban areas
Floods come in varied forms. The most common are fluvial and pluvial floods, and in coastal areas, storm surge floods. Fluvial floods can happen after periods of heavy rainfall. They usually affect areas close to rivers where flood waves can build up gradually or rapidly and last for a longer period. Pluvial floods can happen anywhere and affect all kinds of (urban) areas. They cause flash floods after extreme rainfall in a short period of time because large parts of soil are sealed and therefore cannot absorb the excess of water as drainage systems are overwhelmed. Floods can also manifest as secondary effects of primary perils. This is the case for tropical-cyclone-induced flooding from storm surge and rainfall.
Jérôme Jean Haegeli, Swiss Re’s Group Chief Economist, says: “Economic development continues to be the main driver of the rise in insured losses resulting from floods, but also other perils, seen over many decades. However, with natural catastrophe risks rising and higher price levels, the annual increase of 5–7% in insured losses will continue, and protection gaps could remain high. This highlights the need for adaptation in combination with an adequate insurance coverage that can support financial resilience.”
Losses are likely to increase as climate change intensifies extreme weather events while asset values increase in high-risk areas due to urban sprawl. Adaptation is therefore key, and protective measures, such as dykes, dams and flood gates, are up to ten times more cost-effective than rebuilding.
2024: Hurricanes and severe thunderstorms, with US hardest hit
At least two thirds of this year’s insured losses are attributable to the US: Two major hurricanes made landfall within a fortnight on the coast of Florida in September and October this year. Hurricane Helene made landfall as a major hurricane on 27 September, followed by Hurricane Milton on 9 October. Insured losses from both hurricanes are expected to amount to below USD 50 billion as of today. Additionally, 2024 experienced a high frequency of severe thunderstorms (severe convective storms, or SCS), which affected mostly the US. Insured losses from SCS are expected to add more than USD 51 billion globally for 2024 as of today, the second-highest loss after the record high of approximately USD 70 billion in 2023.
Table 1: Estimated total economic and insured losses in 2024 and 2023
(USD billion in 2024 prices)
2024
2023
Annual change
Previous10-y average
Economic losses (total)
320
302
6%
254
Nat cat
310
291
6%
241
Man-made
10
11
–8%
13
Insured losses (total)
144
125
16%
108
Nat cat
135
115
17%
98
Man-made
9
10
–7%
10
Source: Swiss Re Institute
Chubb Announces Estimated Net Losses for Hurricane Milton of $250-300 Million Pre-Tax and $208-250 Million After-Tax
Chubb Limited (NYSE: CB) announced losses in the fourth quarter of 2024 attributable to Hurricane Milton are estimated to be $250-300 million pre-tax and $208-250 million after-tax, net of reinsurance and including reinstatement premiums.
These estimates include losses generated from the company’s commercial and personal property and casualty insurance businesses as well as its reinsurance operations.
Hannover Re generates quarterly profit of EUR 264 million despite substantial losses and confirms earnings guidance

Gross premiums up by 13.9% adjusted for exchange-rate effects
Major losses in property and casualty reinsurance above budgeted level for the first quarter
Additional provision for possible losses from the war in Ukraine in the low triple-digit million euro range
Pandemic-related losses in life and health reinsurance within the expected range
Gratifying return on investment of 3.1%
Group net income reaches EUR 264 million
Return on equity beats minimum target at 9.3%
Earnings guidance for 2022 confirmed
Hannover Re posted a quarterly profit of EUR 264 million in the first three months and confirms its full-year earnings guidance. That was despite sizeable natural catastrophe claims, further pandemic-related losses in life and health reinsurance and additional strengthening of provisions for possible losses resulting from the war in Ukraine.
“While we are all appalled by the suffering that Russia has unleashed in its war on Ukraine, it is not yet possible to put a concrete figure on the economic impact at this point in time,” said Jean-Jacques Henchoz, Chief Executive Officer of Hannover Re. “Along with the potential implications of the war in Ukraine, we faced numerous natural catastrophes and further pandemic-related strains in life and health reinsurance in the first three months of the year. Against this backdrop, we again demonstrated the quality of our risk and capital management and stood shoulder-to-shoulder with our clients as a reliable partner.”
Hannover Re’s capital adequacy ratio at the end of March was 242% and therefore remained comfortably above the limit of 180% and threshold of 200%.
Gross premiums booked by Hannover Re grows by 19.5%
The gross written premiums booked by Hannover Re increased by 19.5% as of 31 March 2022 to EUR 9.3 billion (EUR 7.8 billion). Growth would have reached 13.9% adjusted for exchange rate effects. Net premiums earned rose by 17.9% to EUR 6.7 billion (EUR 5.7 billion). Growth of 12.4% would have been booked at constant exchange rates.
Group net income reaches EUR 264 million
Operating profit (EBIT) reached EUR 396 million (EUR 404 million) despite the losses incurred in the first quarter. Group net income fell by 13.8% to EUR 264 million (EUR 306 million). Earnings per share stood at EUR 2.19 (EUR 2.54).
Property and casualty reinsurance: Major losses higher than expected
Hannover Re was satisfied overall with the renewal of its property and casualty reinsurance portfolio as of 1 January 2022. 62% of the treaties in traditional property and casualty reinsurance were renegotiated on this date. The inflation- and risk-adjusted price increase amounted to 4.1%, with the biggest gains recorded in Europe.
Gross written premiums grew by 26% as of the end of March to EUR 7.1 billion (EUR 5.7 billion); they would have risen by 19.5% adjusted for exchange rate effects. Net premiums earned was up by 24% to EUR 4.8 billion (EUR 3.9 billion); the increase would have been 18.0% at constant exchange rates.
Expenditures for major losses reached a total of EUR 336 million (EUR 193 million) and thus exceeded the budgeted amount of EUR 284 million for the first quarter. The largest individual losses were the floods in Australia caused by heavy rainfall with net expenditure of EUR 186 million, the windstorm events Ylenia/Zeynep in Europe at a cost of EUR 124 million and the sinking of the cargo ship “Felicity Ace” following a fire with a loss of EUR 14 million.
Hannover Re established an additional general provision in the low triple-digit million euro range in the first quarter for possible losses from the war in Ukraine.
The combined ratio in property and casualty reinsurance increased to 99.5% (96.2%) and thus exceeded the target level of no more than 96%. The underwriting result for property and casualty reinsurance including interest on funds withheld and contract deposits came in well below the previous year’s level at EUR 26 million (EUR 147 million). Despite the substantial losses, it was possible to generate an operating profit (EBIT) of EUR 284 million (EUR 312 million). Net income in property and casualty reinsurance amounted to EUR 177 million (EUR 261 million).
Life and health reinsurance sees decline in pandemic-related losses
In life and health reinsurance Hannover Re continued to expand its financial solutions business, especially in China. Demand for solutions to protect against longevity risks also showed further growth worldwide. Interest here was still particularly strong in the United Kingdom, but also extended to the United States and Canada. The environment for life and health reinsurance was satisfactory on the whole.
The impact of the pandemic remained the dominant issue, especially in relation to mortality covers. As expected, further pandemic-related losses of EUR 123 million were incurred, although these diminished progressively over the course of the quarter.
Gross written premiums increased by 3.2% to EUR 2.2 billion (EUR 2.1 billion), corresponding to a decrease of 1.2% adjusted for exchange rate effects. Net premiums earned rose by 5.4% to EUR 1.9 million (EUR 1.8 billion); growth of 0.8% would have been booked at constant exchange rates.
The operating result (EBIT) increased by 23% to EUR 113 million (EUR 92 million). Net income in life and health reinsurance grew by 78% to EUR 101 million (EUR 57 million).
Very pleasing investment income despite persistent low interest rate environment
The portfolio of assets under own management was stable relative to year-end 2021 with a volume of EUR 56.2 billion.
Ordinary investment income excluding interest on funds withheld and contract deposits totalled EUR 397 million (EUR 310 million) and was thus clearly higher than in the comparable period. Positive profit contributions from inflation-linked bonds again played a part here. The net balance of gains realised on disposals contracted to EUR 42 million (EUR 90 million) and was primarily attributable to sales connected with portfolio maintenance, realisations in the real estate sector as well as regrouping moves in the equity portfolio. Impairments of EUR 15 million (EUR 21 million) were taken. Interest on funds withheld and contract deposits retreated to EUR 55 million (EUR 131 million), principally due to a special effect recorded in the comparable quarter.
In total, investments under own management generated income of EUR 429 million (EUR 311 million). This produced an annualised return on investment of 3.1% that was well above the full-year target of at least 2.3%. Net investment income including interest on funds withheld and contract deposits grew by 9.7% to EUR 484 million (EUR 441 million).
Return on equity remains above minimum target
The shareholders’ equity of Hannover Re dropped by 10.0% as at 31 March to EUR 10.7 billion (31 December 2021: EUR 11.9 billion). Primarily reflecting the rise in interest rates, unrealised losses on fixed-income securities amounted to EUR 1.0 billion at the end of March. This contrasted with unrealised gains of EUR 1.4 billion as at 31 December 2021. The annualised return on equity stood at 9.3% (31 December 2021: 10.8%) and thus continued to outperform the target level of 900 basis points above the risk-free interest rate.
Guidance for 2022 confirmed
It is still too soon to put a definitive figure on losses for global insurance and reinsurance markets resulting from the war in Ukraine. Hannover Re has temporarily stopped writing new risks or renewal of treaties with clients in Russia and Belarus until further notice.
“Even though it will take some time before the impact of the war on insurers and reinsurers can be precisely quantified, we have taken the precaution of establishing additional provisions in the first quarter,” Henchoz said. “Despite all the uncertainties, I remain confident that we can achieve the goals we have set ourselves for the full year thanks to our considerable resilience and robust profitability.”
Hannover Re renews business in the Asia-Pacific region, North America as well as parts of the specialty business as of 1 April 2022. The negotiations resulted in significant growth at improved prices. Premiums volume increased by 17.4%. The inflation- and risk-adjusted price increase for the renewed business amounted to 3.7%.
In life and health reinsurance Hannover Re expects further pandemic-related losses, although these will drop sharply over the course of the year.
On the Group level it remains Hannover Re’s expectation that net income of EUR 1.4 billion to EUR 1.5 billion will be generated for the 2022 financial year. This assumes that major loss expenditure does not materially exceed the budgeted level of EUR 1.4 billion, the Covid-19 pandemic does not have a significant unexpected impact on the result in life and health reinsurance and no unforeseen developments occur on capital markets. The return on investment should reach at least 2.3%.
Hannover Re continues to aim for an ordinary dividend that is higher than in the previous year or at least remains stable. This will be supplemented by a special dividend provided the capitalisation exceeds the capital required for future growth and the profit target is achieved.
The virtual Annual General Meeting of Hannover Rück SE is also being held on today’s date. As already announced, the Executive Board and Supervisory Board have proposed a dividend of EUR 5.75 per share for the 2021 financial year. This is composed of an unchanged ordinary dividend of EUR 4.50 per share plus a special dividend of EUR 1.25 per share.
Hurricanes, cold waves, tornadoes: Weather disasters in USA dominate natural disaster losses in 2021

In 2021, natural disasters caused overall losses of US$ 280bn, of which roughly US$ 120bn were insured
Alongside 2005 and 2011, the year 2021 proved to be the second-costliest ever for the insurance sector (record year 2017: US$ 146bn, inflation-adjusted) – overall losses from natural disasters were the fourth-highest to date (record year 2011: US$ 355bn)
Hurricane Ida was the year’s costliest natural disaster, with overall losses of US$ 65bn (insured losses of US$ 36bn)
In Europe, flash floods after extreme rainfall caused losses of US$ 54bn (€46bn) – the costliest natural disaster on record in Germany
Many of the weather catastrophes fit in with the expected consequences of climate change, making greater loss preparedness and climate protection a matter of urgency
The images of natural disasters in 2021 are disturbing. Climate research increasingly confirms that extreme weather has become more likely. Societies need to urgently adapt to increasing weather risks and make climate protection a priority. Insurers meet their responsibilities by covering a portion of the risks and losses. By applying risk-adequate premiums, they put a price on natural hazards, thereby encouraging carefully considered behaviour to limit the losses. At the same time, severe volcanic eruptions and earthquakes in 2021 showed that we should not overlook these categories of natural disasters either.
Torsten Jeworrek
Member of the Board of Management
Exceptionally high proportion of losses in USA
The USA accounted for a very high share of natural disaster losses in 2021 (roughly US$ 145bn), of which some US$ 85bn were insured. Both overall and insured losses were significantly higher than in the two previous years (Overall losses 2020: US$ 100bn, 2019: US$ 52bn; insured losses 2020: US$ 67bn, 2019: US$ 26bn). In detail:
Tornadoes
In December 2021, a series of severe storms across several states in the central and southeastern USA led to exceptionally high losses, especially for the month of December. Dozens of violent tornadoes with wind speeds of up to 310 km/h (190 mph) carved a trail of devastation across six states. Especially hard hit was the town of Mayfield, Kentucky, where a long-track, massive wedge-type EF4 tornado roared through the neighbourhood. Large parts of the town, including a candle factory, were completely destroyed. According to initial estimates, overall losses amount to around US$ 5.2bn, with projected insured losses of US$ 4bn. An estimated 90 people were killed.
Tropical storms: The Atlantic hurricane season
The costliest natural disaster in 2021 was Hurricane Ida, which made landfall on 29 August 90 km south of New Orleans as a major hurricane (Category 4, the second-most destructive), with wind speeds of around 240 km/h (150 mph). Tens of thousands of buildings were damaged or destroyed. The New Orleans levee system, which was strengthened following Hurricane Katrina in 2005, withstood the storm surges, thereby preventing much higher losses.Hurricane Ida then tracked to the northeast, causing severe flooding, in particular in New Jersey and the New York City metropolitan area. Overall, Hurricane Ida caused losses of US$ 65bn, of which approximately US$ 36bn were insured (55%). A total of 114 people lost their lives.Hard on the heels of the previous record-setting 30 named tropical storms in 2020, storm activity during the 2021 hurricane season was again significantly above the long-term average (14.3 for the period 1991 to 2020), with 21 named tropical storms.
Deep freeze
In February, an exceptional cold wave brought icy temperatures as far as the southern USA. A temperature of -8°C (17°F) was recorded in the southern Texas city of Houston. Although the state of Texas experiences a major freeze event about once a decade, the state’s energy, infrastructure and buildings are often inadequately prepared for such conditions. Millions of people were left without electricity. Overall, with losses of US$ 30bn (half of which were insured), the event was the year’s third-costliest natural disaster.
Europe: Extreme flash floods with record losses
In Europe, torrential rainfall in July 2021 triggered exceptionally severe floodings that caused devastating losses in local areas, particularly in western Germany. In the regions affected, the rainfall caused by the low-pressure system “Bernd” was the highest in over a hundred years. In tributaries, such as the River Ahr in the Rhineland-Palatinate, the deluge triggered flash floods that swept away countless buildings. There was also severe damage to infrastructure, such as railway lines, roads and bridges. More than 220 people were killed.
Overall losses came to €46bn (US$ 54bn), of which €33bn (US$ 40bn) was in Germany. The insured portion was relatively low because of uninsured infrastructure losses and the limited insurance density for flooding in Germany. €11bn (US$ 13bn) was insured, of which €8.2bn (US$ 9.7bn) was in Germany, according to figures provided by the Association of German Insurers. It is the costliest natural disaster in Germany and Europe to date.
What effect is climate change having?
Ernst Rauch, Chief Climate and Geo Scientist at Munich Re, and head of the Climate Solutions Unit, commented as follows on the figures:
“The 2021 disaster statistics are striking because some of the extreme weather events are of the kind that are likely to become more frequent or more severe as a result of climate change. Among these are severe storms in the USA, including in the winter half-year, or heavy rain followed by floods in Europe. For hurricanes, scientists anticipate that the proportion of severe storms and of storms with extreme rainfall will increase because of climate change. Even though events cannot automatically be attributed to climate change, analysis of the changes over decades provides plausible indications of a connection with the warming of the atmosphere and the oceans. Adapting to increasing risks due to climate change will be a challenge.”
Relatively low losses in Asia-Pacific region
In the Asia-Pacific region, losses remained modest. With overall economic losses of US$ 50bn, of which US$ 9bn were insured (insurance gap 83%), the region accounted for just 18% of overall losses and 7% of insured losses. The costliest natural disaster was a severe flood in Henan Province in central China, where countless rivers, including the Yellow River, burst their banks. Hundreds of thousands of homes were flooded. Overall losses came to some US$ 16.5bn, with only about 10% of these insured.
A 7.1-magnitude earthquake struck off the east coast of Japan on 13 February. The earthquake was not far from the epicentre of the Tohoku earthquake off Japan’s northeast coast, which ten years earlier had triggered a devastating tsunami that led to the Fukushima nuclear disaster. The latest earthquake caused substantial losses of US$ 7.7bn, with insured losses in the region of US$ 2.3bn (insurance gap: 70%).
Volcanic eruptions and earthquakes – an underestimated threat?
Along with the earthquakes in Japan, several violent volcanic eruptions following a number of more peaceful years underlined the threats from geophysical catastrophes. In September, the Cumbre Vieja volcano in the south of La Palma in the Canary Islands erupted. Giant streams of lava flowed all the way to the sea. Some 3,000 properties were buried under lava streams and layers of volcanic ash. It was not until 25 December that the authorities were able to officially declare the eruption over. Losses are in the region of €850m (US$ 1bn). Only a small portion of this is likely to be insured.
On the Indonesian island of Java, the Mount Semeru volcano erupted in December. The event produced what are known as pyroclastic flows consisting of hot ash and rock at temperatures of around 1,000°C, which is why such eruptions are far more dangerous than those with lava flows. More than 50 people were killed.
Even in industrialised countries, there is still a large insurance gap
On a global level, around 57% of losses from natural catastrophes in 2021 were not insured. Those affected must bear the financial losses themselves, or rely on aid. This insurance gap has declined over the last few decades in industrialised countries, whereas in poorer countries it remains unchanged at over 90%.
In industrialised countries, the proportion of insured losses depends on the particular natural hazard concerned. For example, in the USA and Europe, insurance density is much lower for floods than for storms. Some infrastructure in the USA is insured, while this is seldom the case in Europe.
“Greater insurance density can help people and countries to better cope with the financial consequences of a disaster and help them return to a normal life. Developing concepts in partnership with governments (public-private partnerships) certainly makes sense,” explains Ernst Rauch.
View more analytically
Performance Shipping Inc. Anticipates Tanker Market Recovery After Fourth Quarter Losses
Performance Shipping Inc., a global shipping company specializing in the ownership of tanker vessels, Friday reported a net loss and net loss from continuing and discontinued operations attributable to common stockholders of $2.5 million for the fourth quarter of 2020, compared to a net loss and net loss from continuing and discontinued operations attributable to common stockholders of $12.2 million for the same period in 2019. Loss per share for the fourth quarter of 2020 was $0.51, while loss per share for the fourth quarter of 2019 was $3.17.
Voyage and time charter revenues from continuing and discontinued operations were $7.2 million ($3.9 million net of voyage expenses) for the fourth quarter of 2020, compared to $10.6 million ($8.5 million net of voyage expenses) for the same period in 2019. This decrease was mainly attributable to the decreased time-charter equivalent rates (TCE rates) achieved during the quarter as a result of the depressed market conditions. Fleetwide, the average time charter equivalent rate for the fourth quarter of 2020 was $10,114, compared with an average rate of $23,153 for the same period of 2019. During the fourth quarter of 2020, net cash provided by operating activities of continuing and discontinued operations was $0.9 million, compared with net cash used in operating activities of continuing and discontinued operations of $0.3 million for the fourth quarter of 2019.
Net income from continuing and discontinued operations for the year ended December 31, 2020, amounted to $3.8 million, compared to a net loss from continuing and discontinued operations of $32.1 million for the year ended December 31, 2019. Net income from continuing and discontinued operations attributable to common stockholders for the year ended December 31, 2020, amounted to $5.2 million, due to a one-time gain of $1.5 million derived from the repurchase of the Series C preferred shares, and resulted in earnings per common share, basic and diluted, of $1.06 and $1.05, respectively. Net loss from continuing and discontinued operations attributable to common stockholders for the year ended December 31, 2019, was $32.1 million, resulting in a loss per share of $11.19.
Fourth Quarter 2020 and Subsequent Developments:
• Appointment of Andreas Michalopoulos as Chief Executive Officer and Anthony Argyropoulos as Chief Financial Officer in October 2020;• Initiation of new variable quarterly dividend policy and declaration of $0.01 dividend per share (or $0.1 per share, as adjusted after the one-for-ten reverse stock split) to all shareholders in October 2020;• Introduction of new business strategy and posting of the relevant presentation on the Company’s website in October 2020;• Effectiveness of a one-for-ten reverse stock split to comply with NASDAQ’s minimum share price rule in November 2020;• Acquisition of 2011-built Aframax tanker vessel “P. Yanbu” for $22.0 million in November 2020;• The signing of a loan agreement with Piraeus Bank S.A. for up to $31.5 million in December 2020, for the partial refinancing of the existing Nordea loan and additional financing for the “P. Yanbu”;• Signing of a supplemental loan agreement with Nordea for repayment schedule re-structuring in December 2020;• Delivery of the Aframax tanker vessel “P. Yanbu” in December 2020;• Entry into an At-The-Market Offering Agreement with H.C. Wainwright Co., LLC, pursuant to which the Company may, at its discretion, sell its common shares at market prices.
Commenting on the results of the fourth quarter of 2020, Mr. Andreas Michalopoulos, the Company’s Chief Executive Officer, stated:
“Spot charter rates during the fourth quarter of 2020 were the lowest in more than 30 years as a result of a combination of weak consumer and industrial demand, and low crude oil and refined petroleum products production. We, at Performance Shipping Inc., nevertheless managed to earn a time charter equivalent rate of $10,114 over our available days compared to the average daily spot Aframax tanker rate of $5,713 during the quarter. We expect the spot charter market to gradually recover through 2021 as the COVID-19 pandemic recedes and demand for crude oil and refined petroleum products recovers. Unfortunately, due to unprecedented low market conditions, we cannot declare and pay a dividend at the present time, but we are pleased to include for the first time in our earnings release our fourth quarter dividend calculation, a specific and transparent table based on which we determine whether we shall pay a dividend. The ATM agreement we will enter into today will position us to fund our stated growth strategy of gradually doubling the size of our fleet over the next twelve to twenty-four months through access to the public equity capital markets when our industry and share price recover in the future.”
Nordic Shipholding Now Expects Losses Between $5 -7 Million, Revised From a Profit of $2.5 – 5 Million
As mentioned in Company Announcement 7/2020 following a strong product tanker market in 1H 2020, the market softened significantly going into 2H 2020. This impacted earnings but even more so, the build-up of products in storage, the declining demand and the continued uncertainty in relation to the COVID-19 pandemic, resulted in a very soft second-hand market with declining values for all tanker segments including product tankers.
As announced in Company Announcement 8/2020 the Nordic Hanne was re-classified as an asset held for sale and in this connection an impairment loss of USD 2.0 million was experienced in H1 2020. Given the softening second-hand market an additional impairment loss of USD 2.2 million will be recognised in Q3.
Consequently, the net carrying value of the remaining fleet has been reassessed and an additional impairment loss of USD 6.5 million has been applied towards these four vessels.
Outlook
The above additional impairment losses totalling USD 8.7 million will be included in the annual result for 2020.
For the rest of 2020, the five vessels will continue to be commercially deployed on a pool basis (including the vessel currently earmarked for sale). Barring unforeseen circumstances, the TCE revenue for 2020 is marginally adjusted and now forecasted to be in the region of USD 27.0 million – USD 29.0 million, revised from USD 28.0 million – USD 31.0 million.
After accounting for operating expenditure budgeted by the respective technical managers, the Group’s expected EBITDA (earnings before interest, tax, depreciation and amortisation) for 2020 is in the range of USD 13.0 million – USD 15.0 million, revised from USD 14.0 million– USD 17.0 million. The result before tax will therefore be a loss between USD 5.0 million – USD 7.0 million including the impairment loss of USD 10.7 million, revised from a profit of USD 2.5 million – USD 5.5 million. The outlook for 2020 does not take into account any further impairment or write-back of impairment of vessels’ carrying values.
The Q3 2020 announcement will be released on 25 November 2020.
Diamond S Shipping Inc. Reports Third Quarter Loss

Diamond S Shipping Inc., one of the largest publicly listed owners and operators of crude oil and product tankers, yesterday announced results for the third quarter of 2020.
Highlights for the Third Quarter and Recent Events
– Reported net loss attributable to Diamond S of $9.7 million, or net loss of $0.24 basic and diluted earnings per share, and Adjusted EBITDA (see Non-GAAP Measures section below) of $27.1 million.
– Net debt at September 30, 2020 was $611.1 million, implying a net debt to asset value leverage ratio of 39% based on broker valuations as of June 2020. At quarter end, total free liquidity available to the Company above bank minimum cash requirements was $124.3 million.
– Agreed to sell a 2009-built MR vessel, the Atlantic Mirage, which is expected to be delivered to the buyers in late Q4 2020. The sale of the vessel is expected to generate approximately $7 million in net proceeds before settlement of working capital.
Craig H. Stevenson Jr., President and CEO of Diamond S, commented: “In these challenging market conditions, we are focused on maintaining safe operations and generating the highest possible cash flow in the spot market. To that end, we are pleased with the performance of our new commercial manager, the Norient Product Pool, who absorbed 28 of our MR vessels during the third quarter and outperformed industry benchmarks. Another priority in this environment is ensuring liquidity and maintaining the strong position of our balance sheet. Our recent agreement to sell one of our MR vessels reinforces our view of the underlying value of our enterprise. We are selling a 2009-built MR tanker for $16.4 million. This asset sale is a tangible marker of the value of our fleet, which is well in excess of our current market capitalization. We will continue to prove out the inherent value of DSSI and, especially given the positive long term outlook for our market, we expect to see the disconnect between our intrinsic value and our share price diminish.”
Third Quarter 2020 Results
Reported net loss attributable to Diamond S for the third quarter of 2020 was $9.7 million, or net loss of $0.24 basic and diluted earnings per share, compared to a net loss of $25.9 million, or $0.65 per basic and diluted share, for the third quarter of 2019, which included the impact of a loss on vessel sales of $18.3 million, or $0.46 per share. The decrease in net income for the third quarter of 2020 compared to the adjusted net income for the third quarter of 2019 is primarily related to weaker tanker market conditions.
The Company groups its business primarily by commodity transported and segments its fleet into a 16-vessel crude oil transportation fleet (the “Crude Fleet”) and a 50-vessel refined petroleum product transportation fleet (the “Product Fleet”). The Crude Fleet consists of 15 Suezmax vessels and one Aframax vessel. The Product Fleet consists of 44 medium range (“MR2”) vessels and 6 Handysize (“MR1”) vessels.
Net revenues for the Company, which represents voyage revenues less voyage expenses, were $79.7 million for the third quarter of 2020 compared to $81.6 million for the third quarter of 2019. Net revenues from the Crude Fleet were $29.4 million in the third quarter of 2020 compared to $23.3 million for the third quarter of 2019. The increase in net revenues for the Crude Fleet were primarily due to a solid start to the quarter as a result of the carryover of strong rates from the first half of 2020. Net revenues from the Product Fleet were $50.3 million in the third quarter of 2020 compared to $58.3 million for the third quarter of 2019. The decrease in net revenues in the Product Fleet was principally driven by weaker market conditions. The weak market conditions were driven by demand destruction caused by the global pandemic, and the unwinding of the floating storage cycle, which effectively increased the supply of available ships.
Vessel expenses were $44.8 million for the third quarter of 2020 compared to $41.8 million for the third quarter of 2019. Vessel expenses, which include crew costs, insurance, repairs and maintenance, lubricants and spare parts, technical management fees and other miscellaneous expenses, increased by $3.0 million primarily due to additional expenses incurred for crew bonuses, increased costs of crew reliefs, testing, quarantine and logistics for delivery of services and materials to the vessels as a result of the global pandemic.
Depreciation and amortization expense was $29.1 million in the third quarter of 2020 compared to $28.8 million for the third quarter of 2019.
General and administrative expenses were $7.7 million in the third quarter of 2020 compared to $7.6 million for the third quarter of 2019.
Interest expense was $7.0 million in the third quarter of 2020 compared to $13.0 million for the third quarter of 2019. Interest expense decreased in the third quarter of 2020 due to a lower average debt balance as a result of debt repayments and a decrease in the effective interest rate. Total gross debt outstanding as of September 30, 2020 was $748.5 million, or 16% lower compared to September 30, 2019.
Other income, which consists primarily of interest income, was less than $0.1 million in the third quarter of 2020, compared to $0.5 million for the third quarter of 2019.
Liquidity
As of September 30, 2020, the Company had $120.3 million in cash and restricted cash and $60.0 million available under its revolving credit facility. Available liquidity as of September 30, 2020 was $124.3 million, net of $56.0 million in restricted cash and minimum cash required by debt covenants.
Outlook
Tanker market conditions are expected to remain under pressure during the fourth quarter of 2020, driven by weak demand for crude oil and refined products as a result of the global pandemic. The typical seasonal market strength is expected to be muted as oil inventories continue to draw from onshore storage and demand has not materially recovered. Tanker supply remains balanced based on pre-pandemic demand levels, and the number of vessels on order nearly matches the number of vessels that might be expected to be scrapped, based on the average useful life of a vessel.
As of November 12, 2020, approximately 58% of Crude Fleet revenue days operating in the spot market in the fourth quarter have been fixed at an average rate of approximately $6,800 per day. In the Product Fleet, 59% of revenue days operating in the spot market have been fixed at an average rate of approximately $9,000 per day in the fourth quarter of 2020. The Product Fleet includes a weighted average blend of MR2 vessels, fixed on 60% of revenue days at an average rate of $9,400 per day, and MR1 vessels, fixed on 53% of fourth quarter revenue days at an average rate of $6,000 per day.
View Full Report
Belships ASA Reports Increased Losses, Looks Towards Market Recovery in the Coming Months
• Operating income of USD 43.3 million (Q3 2019: USD 31.7m)• EBITDA of USD 5.9m (USD 8.1m)• Net result of USD -4.2m (USD 0.3m)• Net TCE per ship of USD 9 067 per day versus BSI index of USD 9 435 net per day• 75 per cent of remaining ship days in 2020 are booked at USD 9 000 net per day• All financing secured till May 2024 onwards after refinancing of SOFIE VICTORY• Imabari newbuilding delivery amended from Q4 2020 to Q1 2021• Belships regarded as leading within corporate governance by Danske Bank and on course for delivering emission cuts in line with industry ambitions for 2030• Commercial platform expanded – Lighthouse Navigation• Modern fleet of 23 vessels with an average age of 5 years including newbuildings
Fleet status
Time charter earnings per ship in the quarter were recorded at USD 9 067 net per day versus BSI index of USD 9 435 net per day for the same period. Average net TCE per ship in the last twelve months amounted to USD 9 263 versus BSI index of USD 7 783 net per day for the same period, representing an outperformance of the BSI index of 19 per cent.
Our long-term outperformance of the BSI index is due to the portfolio of period charter coverage and outsized spot earnings earned by our subsidiary Lighthouse Navigation. The inherent lag in our business means that when the spot markets fall, our outperformance will tend to be higher. Oppositely, when the markets rise rapidly our performance will tend to lag on a short-term basis.
Approximately 30 per cent of remaining ship days in the next four quarters are booked at about USD 10 000 net per day. About 75 per cent of available days in Q4 have been booked at about USD 9 000 net per day.
BELINDA and BELNIPPON (time-chartered vessel) were drydocked in the quarter. The remaining fleet sailed without significant off-hire in the quarter.
BELFAST, an Ultramax newbuilding of 64 000 dwt currently under construction has been amended to deliver January/February 2021 instead of December 2020.
Belships’ fleet modernisation is set to continue with the delivery of newbuildings BELFAST and BELMAR scheduled for delivery during 2021. Belships’ fleet continues to increase and improve with only modest cash investments, signalling the competitive advantage Belships has in sourcing ship finance. Taking into consideration the recent nine acquisitions and two divested vessels at a net cash effect of about USD 3m. The Japanese Ultramax bulk carriers entering the fleet represent the highest quality and lowest fuel consumption available in the market today.
Commercial platform
Lighthouse Navigation has expanded its commercial platform with new offices established in Singapore, Melbourne and most recently Oslo. The aim of this expansion is to further enhance the vessels earning capability and to generate profits around cargo trading opportunities in the market. We expect this part of our business to expand further during 2021.
Sustainability
Belships is regarded as a market leader in corporate governance. Belships is also well placed and on course to deliver emission cuts in line with industry ambitions for 2030. A new carbon footprint study and review has been initiated with leading classification society DNVGL with the aim to monitor performance and identify areas for improvement. With continued fleet modernisation we expect to produce positive results.
Financial and corporate matters
At the end of the quarter, cash and cash equivalents was USD 35.5m, while mortgage debt was USD 142.7m. During the quarter, the loan agreement related to the vessel SOFIE VICTORY was amended in order to prolong the maturity and reduce the loan margin. The group’s mortgage debt now comprises two loan facilities, both with a margin of 275 basis points above LIBOR and maturity in Q2 2024.
Net leasing obligation at the end of the quarter was USD 143.9m. Leasing liabilities have been calculated under the assumption that Belships will exercise its options to acquire all seven Ultramax bulk carriers on bareboat charter, whereas we have assumed that the company will not exercise the purchase options on time-chartered vessels BELNIPPON and BELFUJI. Belships has no contractual obligation to acquire any of its leased vessels.
At the end of the quarter, book value per share amounted to NOK 6.21 (USD 0.65), corresponding to an equity ratio of 32 per cent.
Market highlights
In the third quarter we observed a significant improvement in the spot rates with the Baltic Supramax 58 index averaging USD 9 435 net per day. This is compared to an average of USD 5 210 net per day in the second quarter evidencing a strong rebound since the outbreak of COVID-19.
As some economies began to reopen, demand rebounded from historical lows, with September being the first month showing positive year-on-year growth since the COVID-19 outbreak. Total Supramax shipment volumes came in at 261.3 million metric tons for the quarter, which marked a 9.6 per cent increase from 238.5 million metric tons in Q2. Of the main commodity groups, minor bulks and iron ore made the strongest recovery, growing by about 14 per cent. Seasonal grain shipments also increased markedly by 11 per cent, whereas steels grew by 2.2 per cent.
According to Fearnleys, new vessel deliveries dropped to 26 in Q3 from 43 in the previous quarter, which marked the lowest number of deliveries last two years. The orderbook delivery schedule for next year predict deliveries will be 25 per cent lower than this year, with 115 vessels scheduled for 2021 against 150 vessels this year. In 2022, just 28 vessels are currently scheduled for delivery, which would be the lowest number of deliveries since 2000. In relative terms, we are heading towards the lowest rate of supply growth in almost 30 years. The publicly quoted orderbook indicates fleet growth will drop to about 2 per cent by the end of next year (from currently 4.5 per cent) and in 2022 it will drop further to about 0.5 per cent. There will be changes to this outlook for fleet growth as the amount of newbuilding orders being placed over the next 6-9 months are uncertain and it is also normal that 10-20 per cent of the orderbook ends up being cancelled, deferred or simply incorrect. However, we expect very few newbuilding orders as lack of conviction for fuel and propulsion systems will restrain ordering activity in the near term.
Outlook
The Baltic exchange Supramax index in October averaged USD 10 202 net per day. Freight Forward Agreements (FFA) currently indicate a market for Supramax and Ultramax of about USD 9 400 and 10 400 per day for the remaining part of the year. The softer sentiment in the market during the recent weeks can to some extent be attributed to weak demand outside China, reduced iron ore and coal demand towards the end of the year coupled with usual seasonal slowdown approaching in January and February.
As we mentioned in our previous report, whilst total volumes shipped has rebounded, the supply side has needed to adjust in order to sustain a recovery in rates. The publicly quoted orderbook for our segment now stands at 5 per cent – historically low – and we expect this to lay the foundation for a potentially strong market in 2021. Furthermore, the average sailing speeds have increased which will help the fleet reach higher utilisation levels in a stronger market. We are therefore more optimistic in terms of market prospects, with the main downside risks to our outlook being short term potential lockdowns and year-end import reductions. Belships has a significant part of the fleet contractually covered for the next two quarters.
Belships has a uniform and modern fleet of 23 Supramax/Ultramax bulk carriers whereof nine of our vessels are financed with purchase option agreements. This creates substantial upside and flexibility to capitalise on a potential recovery towards historical averages for vessel values in the future. We are focused on maintaining a solid balance sheet and liquidity position. Our strategy is to continue developing Belships as an owner and operator of geared bulk carriers, through quality of operations and target accretive growth opportunities.
Scorpio Bulkers Inc. Reports Net 9-Month Loss of $206.4 Million
Scorpio Bulkers Inc. reported its results for the three months ended September 30, 2020.
The Company also announced that its Board of Directors has declared a quarterly cash dividend of $0.05 per share on the Company’s common shares.
Share and per share results included herein have been retroactively adjusted to reflect the one-for-ten reverse stock split of the Company’s common shares, which took effect on April 7, 2020.
Results for the Three and Nine Months Ended September 30, 2020 and 2019
For the third quarter of 2020, the Company’s GAAP net loss was $36.6 million, or $3.12 per diluted share, including:
a non-cash loss of approximately $3.7 million and cash dividend income of $0.2 million, or $0.30 per diluted share, from the Company’s equity investment in Scorpio Tankers Inc.; and
a write-down of assets of approximately $19.6 million, or $1.67 per diluted share, related to the classification of the SBI Rock as held for sale and the agreement to sell the SBI Sousta, both of which are Kamsarmax vessels.
For the same period in 2019, the Company’s GAAP net loss was $1.9 million, or $0.28 per diluted share. These results include a non-cash gain of approximately $1.0 million and cash dividend income of $0.5 million, or $0.23 per diluted share, from the Company’s equity investment in Scorpio Tankers Inc., a partial reversal of the write-downs of the SBI Puma and SBI Cougar of approximately $0.2 million, or $0.03 per diluted share, and the write-off of deferred financing costs of approximately $0.5 million, or $0.10 per diluted share.
Total vessel revenues for the third quarter of 2020 were $46.7 million, compared to $63.2 million for the same period in 2019. Earnings before interest, taxes, depreciation and amortization (“EBITDA”) for the third quarter of 2020 was a loss of $13.9 million and EBITDA for the third quarter of 2019 was $26.3 million, respectively .
For the third quarter of 2020, the Company’s adjusted net loss was $17.0 million, or $1.45 adjusted per diluted share, which excludes the impact of the write-down of assets of approximately $19.6 million relating to the classification of one Kamsarmax vessel as held for sale and the agreement to sell another. Adjusted EBITDA for the third quarter of 2020 was $5.7 million .
For the third quarter of 2019, the Company’s adjusted net loss was $2.1 million, or $0.31 adjusted per diluted share, which excludes the partial reversal of the write-downs of the SBI Puma and SBI Cougar of approximately $0.2 million. Adjusted EBITDA for the third quarter of 2019 was $26.1 million .
For the first nine months of 2020, the Company’s GAAP net loss was $206.4 million, or $23.34 per diluted share, including:
a loss of approximately $106.7 million and cash dividend income of $0.9 million, or $12.31 per diluted share, from the Company’s equity investment in Scorpio Tankers Inc.;
a write-down of assets of approximately $36.6 million, or $4.14 per diluted share, related to the classification of the four vessels as held for sale (SBI Taurus, SBI Bolero, SBI Jaguar and SBI Rock) and the agreement to sell the SBI Sousta; and
a write-off of approximately $0.4 million, or $0.04 per diluted share, of deferred financing costs on the credit facilities related to the SBI Taurus, SBI Bolero and SBI Jaguar.
For the first nine months of 2019, the Company’s GAAP net income was $29.6 million, or $4.25 per diluted share. These results include a non-cash gain of approximately $68.6 million and cash dividend income of $1.6 million, or $10.09 per diluted share, from the Company’s equity investment in Scorpio Tankers Inc., a write-down of assets either sold or held for sale and write-off of related deferred financing costs totaling approximately $12.5 million, or $1.79 per diluted share, and the write-off of deferred financing costs of approximately $3.2 million, or $0.45 per diluted share.
Total vessel revenues for the first nine months of 2020 were $113.7 million, compared to $164.3 million for the same period in 2019. EBITDA for the first nine months of 2020 was a loss of $134.6 million and EBITDA for the first nine months of 2019 was $116.8 million .
For the first nine months of 2020, the Company’s adjusted net loss was $169.4 million, or $19.16 adjusted per diluted share, which excludes the impact of the write-down of assets of approximately $36.6 million and the write-off of deferred financing costs on credit facilities related to the three sold vessels of approximately $0.4 million. Adjusted EBITDA for the first nine months of 2020 was a loss of $97.9 million .
For the first nine months of 2019, the Company’s adjusted net income was $42.1 million, or $6.04 adjusted per diluted share, which excludes the impact of the write-down of assets either sold or held for sale of approximately $12.0 million and the write-off of related deferred financing costs of approximately $0.4 million. Adjusted EBITDA for the first nine months of 2019 was $128.9 million.
TCE Revenue
TCE Revenue Earned during the Third Quarter of 2020
Our Kamsarmax fleet (which includes both scrubber fitted and non-scrubber fitted vessels) earned an average of $10,142 revenue per day.
Our Ultramax fleet (which includes both scrubber fitted and non-scrubber fitted vessels) earned an average of $8,930 revenue per day.
Voyages Fixed thus far for the Fourth Quarter of 2020, as of the date hereof
Kamsarmax fleet (which includes both scrubber fitted and non-scrubber fitted vessels): approximately $12,740 revenue per day on average for 42% of the days
Ultramax fleet (which includes both scrubber fitted and non-scrubber fitted vessels): approximately $11,226 revenue per day on average for 45% of the days
Cash and Cash Equivalents
As of October 26, 2020, the Company had approximately $105.5 million in cash and cash equivalents.
Recent Significant Events
COVID-19
Since the beginning of the calendar year 2020, the ongoing outbreak of the novel coronavirus (COVID-19) that originated in China in December 2019 and that has spread to most developed nations of the world has resulted in numerous actions taken by governments and governmental agencies in an attempt to mitigate the spread of the virus. These measures have resulted in a significant reduction in global economic activity and extreme volatility in the global financial and commodities markets. A significant reduction in manufacturing and other economic activities has and is expected to continue to have a materially adverse impact on the global demand for raw materials, coal and other bulk cargoes that our customers transport on our vessels. This significant decline in the demand for dry bulk tonnage may materially and adversely impact our ability to profitably charter our vessels. When these measures and the resulting economic impact will end and what the long-term impact of such measures on the global economy will be are not known at this time. As a result, the extent to which COVID-19 will impact the Company’s results of operations and financial condition will depend on future developments, which are highly uncertain and cannot be predicted.
Quarterly Cash Dividend
In the third quarter of 2020, the Company’s Board of Directors declared and the Company paid a quarterly cash dividend of $0.05 per share totaling approximately $0.6 million.
On October 27, 2020, the Company’s Board of Directors declared a quarterly cash dividend of $0.05 per share, payable on or about December 15, 2020, to all shareholders of record as of November 13, 2020. As of October 27, 2020, 12,386,880 shares were outstanding.
Offshore Wind
Our transition continues, and our conviction towards offshore wind is validated constantly. We are witnessing an unprecedented alignment of scientific, political, and commercial forces, leading to accelerated plans around the world to develop wind energy. Shortly we expect to sign the contract for the construction of our first installation vessel, but other steps will follow. We are re-tooling our organization and our mission to deliver the service that our customers will require.
IMO 2020
As of October 26, 2020, the Company has completed the installation of scrubbers on 17 Ultramax vessels and 10 Kamsarmax vessels and expects installation to be completed on another Ultramax vessel in November 2020. In April 2020, the Company reached an agreement with its counterparties to postpone the installment of scrubbers on thirteen vessels until at least 2021 at no additional cost to the Company.
Financial Results for the Three Months Ended September 30, 2020 Compared to the Three Months Ended September 30, 2019
For the third quarter of 2020, the Company’s GAAP net loss was $36.6 million, or $3.12 per diluted share, compared to a GAAP net loss of $1.9 million, or $0.28 per diluted share, for the same period in 2019. Results for the third quarter of 2020 include: a non-cash loss of approximately $3.7 million and cash dividend income of $0.2 million, or $0.30 per diluted share, from the Company’s equity investment in Scorpio Tankers Inc., and charges of approximately $19.6 million, or $1.67 per diluted share, related to write-downs of the SBI Rock upon its classification as held for sale and the SBI Sousta, which the Company agreed to sell. Results for the third quarter of 2019 include a non-cash gain of approximately $1.0 million and cash dividend income of $0.5 million, or $0.23 per diluted share, from the Company’s equity investment in Scorpio Tankers Inc., a partial reversal of the write-downs of the SBI Puma and SBI Cougar of approximately $0.2 million, or $0.03 per diluted share, and the write-off of deferred financing costs of approximately $0.5 million, or $0.10 per diluted share.
EBITDA for the third quarters of 2020 and 2019 were a loss of $13.9 million and a gain of $26.3 million, respectively .
For the third quarter of 2020, the Company’s adjusted net loss was $17.0 million, or $1.45 adjusted per diluted share, which excludes the impact of the write-down of assets of approximately $19.6 million. Adjusted EBITDA for the third quarter of 2020 was $5.7 million .
For the third quarter of 2019, the Company’s adjusted net loss was $2.1 million, or $0.31 adjusted per diluted share, which excludes the partial reversal of the write-downs of the SBI Puma and SBI Cougar of approximately $0.2 million. Adjusted EBITDA for the third quarter of 2019 was $26.1 million .
The Company’s vessel revenues for the third quarter of 2020 were $46.7 million, compared to $63.2 million in the third quarter of 2019. The Company’s TCE revenue (see Non-GAAP Financial Measures below) for the third quarter of 2020 was $45.0 million, a decrease of $17.7 million from the prior year period.
Total operating expenses for the third quarter of 2020 were $72.5 million, including the charge related to the classification of the SBI Rock as held for sale and the agreement to sell the SBI Sousta of approximately $19.6 million, compared to total operating expenses of $54.5 million in the third quarter of 2019, which also included a partial reversal of the write-downs of the SBI Puma and SBI Cougar of approximately $0.2 million.
Financial Results for the Nine Months Ended September 30, 2020 Compared to the Nine Months Ended September 30, 2019
For the first nine months of 2020, the Company’s GAAP net loss was $206.4 million, or $23.34 per diluted share, including a loss of approximately $106.7 million and cash dividend income of $0.9 million, or $12.31 per diluted share, from the Company’s equity investment in Scorpio Tankers Inc., a write-down of assets of approximately $36.6 million, or $4.14 per diluted share, related to the classification of four vessels (SBI Taurus, SBI Bolero, SBI Jaguar and SBI Rock) as held for sale and the agreement to sell the SBI Sousta and a write-off of approximately $0.4 million, or $0.04 per diluted share, of deferred financing costs on the credit facilities related to three vessels that were sold in the first nine months of 2020 (SBI Taurus, SBI Bolero and SBI Jaguar). For the first nine months of 2019, the Company’s GAAP net income was $29.6 million, or $4.25 per diluted share. These results include a non-cash gain of approximately $68.6 million and cash dividend income of $1.6 million, or $10.09 per diluted share, from the Company’s equity investment in Scorpio Tankers Inc., a write-down of assets either sold or held for sale and write-off of related deferred financing costs totaling approximately $12.5 million, or $1.79 per diluted share, and the write-off of deferred financing costs of approximately $3.2 million, or $0.45 per diluted share.
EBITDA for the first nine months of 2020 and 2019 were a loss of $134.6 million and a gain of $116.8 million, respectively .
For the first nine months of 2020, the Company’s adjusted net loss was $169.4 million, or $19.16 adjusted per diluted share, which excludes the impact of the write-down of assets of approximately $36.6 million and the write-off of deferred financing costs on credit facilities related to the three vessels sold of approximately $0.4 million. Adjusted EBITDA for the first nine months of 2020 was a loss of $97.9 million .
For the first nine months of 2019, the Company’s adjusted net income was $42.1 million, or $6.04 adjusted per diluted share, which excludes the impact of the write-down of assets either sold or held for sale of approximately $12.0 million and the write-off of related deferred financing costs of approximately $0.4 million. Adjusted EBITDA for the first nine months of 2019 was $128.9 million .
The Company’s vessel revenues for the first nine months of 2020 were $113.7 million compared to $164.3 million in the first nine months of 2019. The Company’s TCE revenue for the first nine months of 2020 was $109.2 million, a decrease of $54.3 million from the prior year period.
Total operating expenses for the first nine months of 2020 were $186.8 million, including the write-down of vessels of approximately $36.6 million, compared to $165.2 million in the first nine months of 2019, which included a charge related to the classification of vessels as sold or held for sale of approximately $12.0 million.
ABN AMRO to postpone dividends on the recommendation of the European Central Bank; expects loss in Q1 2020
ABN AMRO has taken notice of the recommendation of the European Central Bank (ECB) to credit institutions under ECB supervision to conserve capital and refrain from making dividend payments and perform share buy-backs until at least 1 October 2020 in order to support the economy in an environment of heightened uncertainty caused by COVID 19.
ABN AMRO’s annual general meeting is expected to take place as planned on 22 April 2020. At the recommendation of the ECB, ABN AMRO has decided to keep the initial proposal for distribution of the dividend for the financial year 2019 but make the actual payment conditional to the reassessment of the situation once the uncertainties caused by COVID 19 disappear (and, in any case, not before 1 October 2020). In addition, ABN AMRO will not pay an interim dividend in August 2020.
ABN AMRO has a strong capital position (CET1 of 18.1% at YE 2019) and a significant buffer above its minimum capital requirements. Given our strong capital and liquidity position and the bank’s important role in the Dutch economy, ABN AMRO was able to announce several measures to support clients affected by the COVID 19 virus in the past 2 weeks. For almost all Commercial Banking clients payments of interest and principal are automatically deferred for 6 months, unless clients opt-out. And clients with a mortgage or a consumer loan affected by COVID 19 can obtain a three month deferral of interest and principal payments.
The long term impact of the Corona virus on the economy, on our clients and on the quality of our loan portfolio is currently uncertain. We expect the FY2020 and especially Q1 2020 cost of risk to be materially higher than the through-the-cycle cost of risk range of 25-30bps. Together with the incidental loss at ABN AMRO Clearing, we expect to record a loss in Q1 2020.