
Dynagas LNG Partners LP To Keep Deleveraging and Boosting Its Liquidity Moving Forward
Dynagas LNG Partners LP, an owner and operator of liquefied natural gas (“LNG”) carriers, announced its results for the three and nine months ended September 30, 2021.
Third Quarter Highlights:
• Net income and earnings per common unit of $11.3 million and $0.23, respectively;
• Adjusted Net Income(1) of $11.6 million and Adjusted Earnings per common unit of $0.24;
• Adjusted EBITDA(1) $24.8 million;
• 100% fleet utilization(2);
• Declared and paid cash distribution of $0.5625 per unit on its Series A Preferred Units (NYSE: “DLNG PR A”) for the period from May 12, 2021 to August 11, 2021 and $0.546875 per unit on the Series B Preferred Units (NYSE: “DLNG PR B”) for the period from May 22, 2021 to August 21, 2021;
• The LNG carrier Arctic Aurora was delivered to Equinor ASA (“Equinor”) to commence its new time charter on September 15, 2021 immediately upon expiration of the previous charter party with Equinor, resulting in no lapse in time between the previous and the current time charters. The term “in direct continuation” does not refer to the contracted income.
Subsequent Events:
• Declared a quarterly cash distribution of $0.5625 on the Series A Preferred Units for the period from August 12, 2021 to November 11, 2021, which was paid on November 12, 2021 to all preferred Series A unit holders of record as of November 5, 2021; and
• Declared a quarterly cash distribution of $0.546875 on the Series B Preferred Units for the period from August 22, 2021 to November 21, 2021, which is payable on November 22, 2021 to all preferred Series B unit holders of record as of November 15, 2021.
(1)Adjusted EBITDA, Adjusted Net Income, and Adjusted Earnings per common unit are not recognized measures under U.S. GAAP. Please refer to Appendix B of this press release for the definitions and reconciliation of these measures to the most directly comparable financial measures calculated and presented in accordance with U.S. GAAP and other related information.
(2)Please refer to Appendix B.
CEO Commentary:
We are pleased to report the results for the three and nine months period ended September 30, 2021.
All six LNG carriers in our fleet are operating under their respective long-term charters with international gas producers with an average remaining contract term of 7.2 years. As of November 18, 2021, our estimated contracted revenue backlog is $1.06 billion.
With the Arctic Aurora successfully delivered to Equinor on September 15, 2021, all six of our LNG carriers are contracted with major international energy companies. The earliest contracted re-delivery date for any of our six LNG carriers, subject to the terms of the applicable charter, is in the third quarter of 2023 (the Arctic Aurora), with the second earliest contracted re-delivery date (for the Clean Energy) in the first quarter of 2026.
For the third quarter of 2021, we reported Net Income of $11.3 million, Earnings per common unit of $0.23, Adjusted Net Income of $11.6 million, Adjusted Earnings per common unit of $0.24 and Adjusted EBITDA of $24.8 million.
Despite the continuing operational and logistical challenges caused by the COVID-19 outbreak, we are pleased to report 100% utilization of our fleet for the sixth quarter in a row.
Going forward, we intend to continue our strategy of using our cash flow generation to deleverage our balance sheet and reinforce our liquidity to build equity value over time and enhance our ability to pursue future growth initiatives.
Financial Results Overview:
(1) Adjusted Net Income, Adjusted EBITDA, and Adjusted Earnings per common unit are not recognized measures under U.S. GAAP. Please refer to Appendix B of this press release for the definitions and reconciliation of these measures to the most directly comparable financial measures calculated and presented in accordance with U.S. GAAP.
Three Months Ended September 30, 2021 and 2020 Financial Results
Net Income for the three months ended September 30, 2021 was $11.3 million as compared to a Net Income of $10.0 million in the corresponding period in 2020, which represents an increase of $1.3 million, or 13.0%. This increase in net income for the three months ended September 30, 2021 compared to the corresponding period in 2020, was mainly attributable to the increase in voyage revenues as well as to the decrease in finance costs, partially offset by the increase in loss on our interest rate swap transaction entered into in May 2020.
Adjusted Net Income for the three months ended September 30, 2021 was $11.6 million compared to $10.2 million in the corresponding period in 2020, representing a net increase of $1.4 million or 13.7%, mainly due to the increase in voyage revenues as well as to the decrease in finance costs compared to the corresponding period in 2020.
Voyage revenues for the three months ended September 30, 2021 and 2020 were $34.7 million and $34.3 million respectively.
The Partnership reported average daily hire gross of commissions(1) of approximately $62,800 per day per vessel in the three-month period ended September 30, 2021, compared to approximately $62,500 per day per vessel in the corresponding period in 2020. During both three-month periods ended September 30, 2021 and 2020, the Partnership’s vessels operated at 100% utilization.
Vessel operating expenses were $7.0 million, which corresponds to daily operating expenses per vessel of $12,641 in the three-month period ended September 30, 2021, as compared to $7.2 million, or daily operating expenses per vessel of $13,074 in the corresponding period in 2020. This decrease in operating expenses for the three months ended September 30, 2021 is mainly attributable to lower expenses related to the vessels’ technical maintenance costs, compared to the corresponding period in 2020.
Adjusted EBITDA for the three months ended September 30, 2021 was $24.8 million, as compared to $24.2 million for the corresponding period in 2020. The increase of $0.6 million in Adjusted EBITDA for the three months ended September 30, 2021, or 2.5%, was mainly due to the increase in voyage revenues and the decrease in operating expenses compared to the corresponding period in 2020 as explained above.
Interest and finance costs, net, were $5.3 million in the three months ended September 30, 2021 as compared to $6.0 million in the corresponding period in 2020, which represents a decrease of $0.7 million, or 11.7% due to the lower weighted average interest and the reduction in the average interest bearing debt as compared to the corresponding period in 2020.
For the three months ended September 30, 2021, the Partnership reported Earnings per common unit and Adjusted Earnings per common unit, basic and diluted, of $0.23 and $0.24 respectively, after taking into account the distributions relating to the Series A Preferred Units and the Series B Preferred Units on the Partnership’s Net income/Adjusted Net Income. Earnings per common unit and Adjusted Earnings per common unit, basic and diluted, are calculated on the basis of a weighted average number of 36,802,247 common units outstanding during the period and in the case of Adjusted Earnings per common unit after reflecting the impact of the non-cash items presented in Appendix B of this press release.
Adjusted Net Income, Adjusted EBITDA and Adjusted Earnings per common unit are not recognized measures under U.S. GAAP. Please refer to Appendix B of this press release for the definitions and reconciliation of these measures to the most directly comparable financial measures calculated and presented in accordance with U.S. GAAP.
Amounts relating to variations in period–on–period comparisons shown in this section are derived from the condensed financials presented below.
(1) Average daily hire gross of commissions represents voyage revenue excluding the non-cash time charter deferred revenue amortization, divided by the Available Days in the Partnership’s fleet as described in Appendix B.
Liquidity/ Financing/ Cash Flow Coverage
During the three months ended September 30, 2021, the Partnership generated net cash from operating activities of $19.8 million as compared to $27.6 million in the corresponding period in 2020, which represents a decrease of $7.8 million, or 28.3%, mainly as a result of working capital variations.
As of September 30, 2021, the Partnership reported total cash of $91.3 million (including $50.0 million of restricted cash). The Partnership’s outstanding indebtedness as of September 30, 2021 under the $675.0 Million Credit Facility amounted to $579.0 million, gross of unamortized deferred loan fees and including $48.0 million, which were repayable within one year.
As of September 30, 2021, the Partnership had unused availability of $30.0 million under its interest free $30.0 million revolving credit facility with its Sponsor, or the $30.0 Million Revolving Credit Facility, which was extended on November 14, 2018, and is available to the Partnership at any time until November 2023.
Vessel Employment
As of November 18, 2021, the Partnership had estimated contracted time charter coverage(1) for 100% of its fleet estimated Available Days (as defined in Appendix B) for 2021, 100% of its fleet estimated Available Days for 2022 and 96% of its fleet estimated Available Days for 2023.
As of the same date, the Partnership’s estimated contracted revenue backlog (2) (3) was $1.06 billion, with an average remaining contract term of 7.2 years.
(1) Estimated time charter coverage for the Partnership’s fleet is calculated by dividing the fleet contracted days on the basis of the earliest estimated delivery and redelivery dates prescribed in the Partnership’s current time charter contracts, net of scheduled class survey repairs by the number of expected Available Days during that period. Actual time charter coverage may vary.
(2) The Partnership calculates its estimated contracted revenue backlog by multiplying the contractual daily hire rate by the expected number of days committed under the contracts (assuming earliest delivery and redelivery and excluding options to extend), assuming full utilization. The actual amount of revenues earned and the actual periods during which revenues are earned may differ from the amounts and periods disclosed due to, for example, dry-docking and/or special survey downtime, maintenance projects, off-hire downtime and other factors that result in lower revenues than the Partnership’s average contract backlog per day.
(3) $0.15 billion of the revenue backlog estimate relates to the estimated portion of the hire contained in certain time charter contracts with Yamal which represents the operating expenses of the respective vessels and is subject to yearly adjustments on the basis of the actual operating costs incurred within each year. The actual amount of revenues earned in respect of such variable hire rate may therefore differ from the amounts included in the revenue backlog estimate due to the yearly variations in the respective vessels’ operating costs.
View Full Report
Dynagas LNG Partners LP Reports First Quarter Net Income of $15.0 Million, to Continue Deleveraging
Dynagas LNG Partners LP, an owner and operator of liquefied natural gas (“LNG”) carriers, announced its results for the three months ended March 31, 2021.
Quarter Highlights:
– Net income and earnings per common unit of $15.9 million and $0.36, respectively;
– Adjusted Net Income(1) and Adjusted EBITDA(1) of $10.6 million and $23.9 million, respectively;100% fleet utilization(2);
– Declared and paid cash distribution of $0.5625 per unit on its Series A Preferred Units (NYSE: “DLNG PR A”) for the period from November 12, 2020 to February 11, 2021 and $0.546875 per unit on the Series B Preferred Units (NYSE: “DLNG PR B”) for the period from November 22, 2020 to February 21, 2021; and
– Sold $1.32 million of common units at an average price per unit of $2.9800 pursuant to the Partnership’s Amended & Restated Sales Agreement, which has $28.7 million of remaining availability as of March 31, 2021.
Subsequent Events:
– Declared a quarterly cash distribution of $0.5625 on the Partnership’s Series A Preferred Units for the period from February 12, 2021 to May 11, 2021, which was paid on May 12, 2021;
– Declared a quarterly cash distribution of $0.546875 on the Partnership’s Series B Preferred Units for the period from February 22, 2021 to May 21, 2021, which was paid on May 24, 2021;
– Sold $2.15 million of common units at an average price per unit of $2.8769 pursuant to the Partnership’s Amended & Restated Sales Agreement, which has $26.5 million of remaining availability; andEntered into a new time charter party agreement with Equinor ASA (“Equinor”) for the employment of our LNG carrier Arctic Aurora. Under the new time charter agreement, the Arctic Aurora is expected to be delivered to Equinor in September 2021 in direct continuation of the current charter party with Equinor, meaning there will be no lapse of time between the current and the new time charter. The term ‘in direct continuation’ does not refer to the contracted income.
(1) Adjusted Net Income and Adjusted EBITDA are not recognized measures under U.S. GAAP. Please refer to Appendix B of this press release for the definitions and reconciliation of these measures to the most directly comparable financial measures calculated and presented in accordance with U.S. GAAP and other related information.
(2) Please refer to Appendix B.
CEO Commentary:
We are pleased to report the results for the three months ended March 31, 2021.
All six LNG carriers in our fleet are operating under their respective long-term charters with international gas producers with an average remaining contract term of 7.7 years. As of March 31, 2021, our estimated contracted revenue backlog is approximately $1.12 billion.
After securing a new two year charter for the Arctic Aurora with Equinor, and barring any unforeseen events, the earliest contracted re-delivery date for any of our six LNG carriers is in the third quarter of 2023 (the Arctic Aurora), with the next carrier (the Clean Energy) becoming available for re-chartering in the first quarter of 2026.
For the first quarter of 2021, we reported Net Income of $15.9 million, earnings per common unit of $0.36, Adjusted Net Income of $10.6 million and Adjusted EBITDA of $23.9 million.
Despite the ongoing operational challenges the industry is facing as a result of the COVID-19 outbreak, we are pleased to report 100% utilization for our fleet for the first quarter of 2021.
Going forward, we intend to continue our strategy of using our cash flow generation to deleverage our balance sheet and reinforce our liquidity so as to build equity value over time. This, we believe, will enhance our ability to pursue future growth initiatives.
Three Months Ended March 31, 2021 and 2020 Financial Results
Net Income for the three months ended March 31, 2021 was $15.9 million as compared to a Net Income of $7.0 million for the corresponding period of 2020, which represents an increase of $8.9 million, or 127.1%. The increase in net income for the three months ended March 31, 2021 was mainly attributable to the decrease in finance costs as well as to the increase in gain on our interest rate swap transaction entered into in May 2020 compared to the corresponding period of 2020.
Adjusted Net Income for the three months ended March 31, 2021 was $10.6 million compared to $7.1 million for the corresponding period of 2020, which represents a net increase of $3.5 million or 49.3%, mainly due to decreased finance costs.
Voyage revenues for the three months ended March 31, 2021 were $33.4 million as compared to $34.5 million for the corresponding period of 2020, which represents a decrease of $1.1 million, mainly as a result of the lower variable hire revenues earned on the Lena River in the three months ended March 31, 2021 compared to the corresponding period in 2020.
The Partnership reported average daily hire gross of commissions(1) of approximately $62,250 per day per vessel in the three-month period ended March 31, 2021, compared to approximately $63,100 per day per vessel for the corresponding period of 2020. During the three-month periods ended March 31, 2021 and March 31, 2020, the Partnership’s vessels operated at 100% and 99.0% utilization, respectively.
Vessel operating expenses were $6.9 million, which corresponds to a daily rate per vessel of $12,739 in the three-month period ended March 31, 2021, as compared to $7.6 million, or a daily rate per vessel of $13,872 in the corresponding period of 2020. This decrease is mainly attributable to lower planned engine maintenance on the Lena River during the first quarter of 2021 compared to the first quarter of 2020.
Adjusted EBITDA for the three months ended March 31, 2021 was $23.9 million, as compared to $23.7 million for the corresponding period of 2020. The increase of $0.2 million, or 0.8%, was mainly due to the net effect of the decrease in revenues and decrease in the vessels’ operating expenses as explained above.
Interest and finance costs, net were $5.5 million in the three months ended March 31, 2021 as compared to $8.8 million in the corresponding period of 2020, which represents a decrease of $3.3 million, or 37.5% due to the (i) lower weighted average interest and (ii) the reduction in interest bearing debt as compared to the corresponding period of 2020.
For the three months ended March 31, 2021, the Partnership reported basic and diluted Earnings per common unit and Adjusted Earnings per common unit, of $0.36 and $0.21 respectively, after taking into account the distributions relating to the Series A Preferred Units and the Series B Preferred Units on the Partnership’s Net income/Adjusted Net Income. Earnings per common unit and Adjusted Earnings per common unit, basic and diluted, are calculated on the basis of a weighted average number of 35,735,752 common units outstanding during the period and in the case of Adjusted Earnings per common unit after reflecting the impact of the non-cash items presented in Appendix B of this press release.
Adjusted Net Income, Adjusted EBITDA and Adjusted Earnings per common unit are not recognized measures under U.S. GAAP. Please refer to Appendix B of this press release for the definitions and reconciliation of these measures to the most directly comparable financial measures calculated and presented in accordance with U.S. GAAP.
Amounts relating to variations in period–on–period comparisons shown in this section are derived from the condensed financials presented below.
(1) Average daily hire gross of commissions represents voyage revenue excluding the non-cash time charter deferred revenue amortization, divided by the Available Days in the Partnership’s fleet as described in Appendix B.
Liquidity/ Financing/ Cash Flow Coverage
During the three months ended March 31, 2021, the Partnership generated net cash from operating activities of $22.9 million as compared to $18.7 million in the corresponding period of 2020, which represents an increase of $4.2 million, or 22.5%.
As of March 31, 2021, the Partnership reported total cash of $84.1 million (including $50.0 million of restricted cash). The Partnership’s outstanding indebtedness as of March 31, 2021 under the $675.0 Million Credit Facility amounted to $603.0 million, gross of unamortized deferred loan fees and including $48.0 million, which was repayable within one year.
During the three months ended March 31, 2021, the Partnership sold $1.32 million of common units at an average price per unit of $2.9800 pursuant to the amended and restated ATM Sales Agreement entered into in August 2020, for the offer and sale of common units representing limited partnership interests, having an aggregate offering amount of up to $30.0 million (the “Current ATM Program”). Following these sales, the Current ATM Program has $28.7 million of remaining availability and the Partnership has 36,054,214 units issued and outstanding.
As of March 31, 2021, the Partnership had unused availability of $30.0 million under its interest free $30.0 million revolving credit facility with its Sponsor, or the $30.0 Million Revolving Credit Facility, which was extended on November 14, 2018, and is available to the Partnership at any time until November 2023.
Vessel Employment
As of June 17, 2021, the Partnership had estimated contracted time charter coverage(1) for 100% of its fleet estimated Available Days (as defined in Appendix B) for 2021, 100% of its fleet estimated Available Days for 2022 and 94% of its fleet estimated Available Days for 2023.
As of the same date, the Partnership’s estimated contracted revenue backlog estimate (2) (3) was $1.12 billion, with an average remaining contract term of 7.7 years.
(1) Time charter coverage for the Partnership’s fleet is calculated by dividing the fleet contracted days on the basis of the earliest estimated delivery and redelivery dates prescribed in the Partnership’s current time charter contracts, net of scheduled class survey repairs by the number of expected Available Days during that period.
(2) The Partnership calculates its estimated contracted revenue backlog by multiplying the contractual daily hire rate by the expected number of days committed under the contracts (assuming earliest delivery and redelivery and excluding options to extend), assuming full utilization. The actual amount of revenues earned and the actual periods during which revenues are earned may differ from the amounts and periods disclosed due to, for example, dry-docking and/or special survey downtime, maintenance projects, off-hire downtime and other factors that result in lower revenues than the Partnership’s average contract backlog per day.
(3) $0.15 billion of the revenue backlog estimate relates to the estimated portion of the hire contained in certain time charter contracts with Yamal which represents the operating expenses of the respective vessels and is subject to yearly adjustments on the basis of the actual operating costs incurred within each year. The actual amount of revenues earned in respect of such variable hire rate may therefore differ from the amounts included in the revenue backlog estimate due to the yearly variations in the respective vessels’ operating costs.
Dynagas LNG Partners LP Announces New Time Charter for the LNG Carrier Arctic Aurora
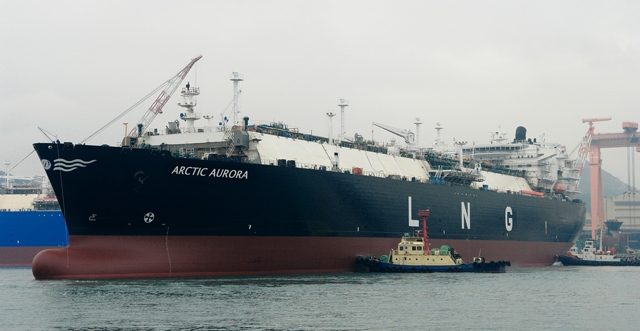
Dynagas LNG Partners LP, an owner and operator of liquefied natural gas (“LNG”) carriers, announced that it has entered into a new time charter party agreement with Equinor ASA (“Equinor”) for the employment of the 2013 built ice class LNG carrier Arctic Aurora.
Under the new time charter agreement, the Arctic Aurora is expected to be delivered to Equinor in September 2021 in direct continuation of the current charter party with Equinor, meaning there will be no lapse of time between the current and the new time charter. The term ‘in direct continuation’ does not refer to the contracted income.
The time charter period is about 2 years and the annual gross revenues from the time charter agreement are expected to be about $21.5 million.
Tony Lauritzen, Chief Executive Officer of Dynagas LNG Partners LP, commented:
“We are very pleased to enter into this new agreement with Equinor, with whom the Arctic Aurora has been employed since its delivery in 2013, reflecting our long-standing relationship with Equinor and the outstanding operational performance of the Arctic Aurora and our manager throughout the years.”
Increased Voyage Revenues Propel Second Quarter Net Income for Dynagas LNG Partners LP
Dynagas LNG Partners LP, an owner and operator of liquefied natural gas (“LNG”) carriers, announced its results for the three and six months ended June 30, 2020.
Quarter Highlights:
Net income of $6.4 million and earnings per common unit of $0.10, after accounting for $3.4 million of non-cash market to market interest rate swap losses;Adjusted Net Income(1) of $9.9 million and Adjusted Earnings per common unit of $0.20 excluding the non-cash mark to market interest rate swap losses;Adjusted EBITDA(1) of $24.1 million;100% fleet utilization;Declared and paid cash distribution of $0.5625 per unit on its Series A Preferred Units (NYSE: “DLNG PR A”) for the period from February 12, 2020 to May 11, 2020 and $0.546875 per unit on the Series B Preferred Units (NYSE: “DLNG PR B”) for the period from February 22, 2020 to May 21, 2020; andEntered into a floating to fixed interest rate swap transaction effective from June 29, 2020 which provides for a fixed 3-month LIBOR rate of 0.41% based on notional values that reflect the amortization schedule of 100% of the Partnership’s debt outstanding under its $675 Million Credit Facility, until the $675 Million Credit Facility matures in September 2024.
Subsequent Events:
Declared a quarterly cash distribution of $0.5625 on the Series A Preferred Units for the period from May 12, 2020 to August 11, 2020, which was paid on August 12, 2020;Declared a quarterly cash distribution of $0.546875 on the Series B Preferred Units for the period from May 22, 2020 to August 21, 2020, which was paid on August 24, 2020; andIn August 2020, the Partnership entered into an amended and restated ATM Sales Agreement (the “A&R Sales Agreement”), for the offer and sale of common units representing limited partnership interests, having an aggregate offering price of up to $30.0 million (the “Current ATM Program”). Upon entry into the A&R Sales Agreement, the Partnership terminated its prior at-the-market program established in July 2020 (the “Prior ATM Program”). At the time of such termination, $0.4 million of the Partnership’s common units out of an aggregate of $30.0 million of its common units were sold pursuant to the Prior ATM Program.(1) Adjusted EBITDA, Adjusted Net Income, and Adjusted Earnings per common unit are not recognized measures under U.S. GAAP. Please refer to Appendix B of this press release for the definitions and reconciliation of these measures to the most directly comparable financial measures calculated and presented in accordance with U.S. GAAP and other related information.
CEO Commentary:
We are pleased to report the results for the three months and six months ended June 30, 2020. All six LNG carriers in our fleet are operating under their respective long-term charters with international gas producers with an average remaining contract term of 8.1 years. The earliest contracted re-delivery date for our six LNG carriers is in the third quarter of 2021 (the Arctic Aurora), with the next carrier (the Clean Energy) becoming available for re-chartering in the first quarter of 2026 at the earliest.
For the second quarter of 2020, we reported Net Income of $6.4 million and Adjusted EBITDA of $24.1 million. This improved performance is attributable to an increase in voyage revenues and a decrease in interest and finance costs compared to the corresponding period in 2019, coupled with stable vessel operating expenses during this period.
Despite the ongoing operational challenges the industry is facing as a result of the COVID-19 outbreak, we are pleased to report 100% utilization for our fleet for the second quarter of 2020. The ongoing impact of the COVID-19 outbreak has been operationally manageable due to our manager’s COVID-19 response plan which has been implemented with the support of our seafarers, charterers and employees, for which we are grateful.
Pursuant to our general objective to manage the cost of debt, we made use of the historically low interest rate environment and entered into a floating to fixed interest rate swap transaction effective from June 29, 2020 until the existing $675.0 Million Credit Facility expires in 2024. The swap provides for a fixed 3-month LIBOR rate of 0.41% and an effective interest rate cost of 3.41% (including margin) applicable for notional amounts matching the full amount and period of our outstanding debt. This was a key development in the execution of our strategic plan as it de-risks our exposure to interest rate volatility while securing a low cost of debt until 2024.
Additionally, in August 2020 we entered into an “at the market” offering program, pursuant to which the Partnership may offer and sell up to $30 million of its common units. Going forward, we intend to continue our strategy of using our cash flow generation to deleverage our balance sheet, reinforce our liquidity and generate cash so as to build equity over time. This, we believe, will enhance our ability to pursue future growth initiatives.
Three Months Ended June 30, 2020 and 2019 Financial Results
Net Income for the three months ended June 30, 2020 was $6.4 million as compared to a Net Income of $0.9 million in the corresponding period of 2019, which represents an increase of $5.5 million, or 611.1%. This increase was mainly attributable to an increase in voyage revenues as well as a decrease in interest and finance costs compared to the corresponding period of 2019. The increase in net income was partially offset by a $3.4 million unrealised loss on the Partnership’s interest rate swap transaction recognised in this quarter (no derivative instruments in the corresponding quarter of 2019) further to the commencement of the Partnership’s interest rate swap transaction effective from June 29, 2020 (see further below).
Adjusted Net Income (which excludes non cash flow items including the above mentioned unrealized loss of $3.4 million on the interest rate swap transaction), for the three months ended June 30, 2020 was $9.9 million compared to $0.8 million in the corresponding period of 2019, representing a net increase of $9.1 million or 1,137.5%.
Voyage revenues for the three months ended June 30, 2020 were $33.9 million as compared to $30.8 million for the corresponding period of 2019, which represents an increase of $3.1 million, mainly as a result of the higher revenues earned on the Lena River following its delivery to its multi-year contract with Yamal Trade Pte (“Yamal”) in July 2019.
The Partnership reported average daily hire gross of commissions(1) of approximately $62,200 per day per vessel in the three-month period ended June 30, 2020, compared to approximately $55,100 per day per vessel in the corresponding period of 2019. During the three-month periods ended June 30, 2020 and 2019, the Partnership’s vessels operated at 100% and 94.4% utilization, respectively.
Vessel operating expenses were $6.9 million in both three-month periods ended June 30, 2020 and 2019, which corresponds to the same daily rate per vessel of $12,630.
Adjusted EBITDA for the three months ended June 30, 2020 was $24.1 million, as compared to $20.9 million for the corresponding period of 2019. The increase of $3.2 million, or 15.3%, was mainly due to the increase in revenues as explained above.
Interest and finance costs, net, were $6.3 million in the three months ended June 30, 2020 as compared to $12.5 million in the corresponding period of 2019, which represents a decrease of $6.2 million, or 49.6% due to the lower weighted average interest and the reduction in the average interest bearing debt as compared to the corresponding period of 2019.
On May 7, 2020, the Partnership entered into a floating to fixed interest rate swap transaction effective from June 29, 2020. It provides a fixed 3-month LIBOR rate of 0.41% based on notional values that reflect the amortization schedule of 100% of the Partnership’s debt outstanding under its $675 Million Credit Facility, until the $675 Million Credit Facility matures in September 2024. The Partnership recognized an unrealised loss on the derivative financial instrument of $3.4 million as of June 30, 2020.
For the three months ended June 30, 2020, the Partnership reported Earnings per common unit and Adjusted Earnings per common unit, basic and diluted, of $0.10 and $0.20 respectively, after taking into account the distributions relating to the Series A Preferred Units and the Series B Preferred Units on the Partnership’s Net income/Adjusted Net Income. Earnings per common unit and Adjusted Earnings per common unit, basic and diluted, are calculated on the basis of a weighted average number of 35,490,000 common units outstanding during the period and in the case of Adjusted Earnings per common unit after reflecting the impact of the non-cash items presented in Appendix B of this press release.
Adjusted Net Income, Adjusted EBITDA and Adjusted Earnings/(Loss) per common unit are not recognized measures under U.S. GAAP. Please refer to Appendix B of this press release for the definitions and reconciliation of these measures to the most directly comparable financial measures calculated and presented in accordance with U.S. GAAP.
Liquidity/ Financing/ Cash Flow Coverage
During the three months ended June 30, 2020, the Partnership generated net cash from operating activities of $8.1 million as compared to $7.0 million in the corresponding period of 2019, which represents an increase of $1.1 million, or 15.7%.
As of June 30, 2020, the Partnership reported total cash of $63.3 million (including $50.0 million of restricted cash). The Partnership’s outstanding indebtedness as of June 30, 2020 under the $675.0 Million Credit Facility amounted to $639.0 million, gross of unamortized deferred loan fees and including $48.0 million, which was repayable within one year.
As of June 30, 2020, the Partnership had unused availability of $30.0 million under its interest free $30.0 million revolving credit facility with its Sponsor, or the $30.0 Million Revolving Credit Facility, which was extended on November 14, 2018, and is available to the Partnership at any time until November 2023.
Vessel Employment
As of September 3, 2020, the Partnership had estimated contracted time charter coverage(1) for 100% of its fleet estimated Available Days (as defined in Appendix B) for 2020, 92% of its fleet estimated Available Days for 2021 and 83% of its fleet estimated Available Days for 2022.
As of the same date, the Partnership’s contracted revenue backlog estimate was $1.18 billion, with an average remaining contract term of 8.1 years.