
Navios Maritime Partners L.P. Reports Second Quarter Net Income of $100 Million as Container and Dry Bulk Markets Excel

Navios Maritime Partners L.P., an international owner and operator of dry cargo vessels, reported its financial results for the second quarter and six month period ended June 30, 2021.
Angeliki Frangou, Chairman and Chief Executive Officer of Navios Partners stated, “I am pleased with the results for the second quarter of 2021. During the second quarter, Navios Partners recorded revenue of $152.0 million and net income of $99.9 million.”
Angeliki Frangou continued, “Navios Partners is a top-10 US publicly listed shipping company with a dry cargo fleet of 98 vessels. Of our fleet, 56% are dry bulk vessels and 44% are containerships. This diversified fleet should not only insulate us from normal industry cyclicality, but create optionality as we leverage fundamentals across sectors and reduce cost of capital. Our balance sheet is also strong, with 27.3% net debt to book capitalization and no near term debt maturities.”
Fleet Update
Acquisition of six 5,300 TEU Newbuilding Containerships (four plus two on Navios Partners’ option)
In July 2021, Navios Partners agreed to purchase six 5,300 TEU newbuilding containerships (four plus two optional) for a purchase price of $61.6 million each. The vessels are expected to be delivered into Navios Partners’ fleet during the second half of 2023 and 2024.The closing of the transaction is subject to completion of customary documentation.
Acquisition of one Newbuilding Capesize Vessel
In June 2021, Navios Partners agreed to bareboat charter-in one Japanese newbuilding Capesize vessel from an unrelated third party. The vessel has approximately 180,000 dwt and is being bareboat chartered-in for 10 years. Navios Partners has the option to acquire the vessel starting at the end of year four until the end of the tenth year. The implied acquisition price is approximately $60.0 million and the annual effective interest rate is approximately 4.3%. The vessel is expected to be delivered into Navios Partners’ fleet during the second half of 2022.
Acquisition of one Newbuilding Kamsarmax Vessel
In June 2021, Navios Partners agreed to acquire from an unrelated third party a newbuilding Kamsarmax vessel for a purchase price of $34.3 million. The vessel has approximately 81,000 dwt and is expected to be delivered into Navios Partners’ fleet during the first half of 2023.
Acquisition of three Capesize Vessels
In June 2021, Navios Partners agreed to acquire from Navios Maritime Holdings Inc. (“Navios Holdings”) (NYSE:NM) the Navios Azimuth, a 2011-built Capesize vessel of 179,169 dwt, the Navios Ray, a 2012-built Capesize vessel of 179,515 dwt, and the Navios Bonavis, a 2009-built Capesize vessel of 180,022 dwt for an aggregate purchase price of $88.0 million. The Navios Bonavis and the Navios Ray were delivered into Navios Partners’ fleet in June 2021 and the Navios Azimuth was delivered in July 2021. The acquisition of these vessels was approved by the Conflicts Committee of the Board of Directors of Navios Partners.
Sale of Two Vessels
In July 2021, Navios Partners agreed to sell the Harmony N, a 2006-built Containership of 2,824 TEU, to an unrelated third party for a net sale price of $28.7 million. The sale is expected to be completed during the third quarter of 2021.
In July 2021, Navios Partners agreed to sell the Navios Azalea, a 2005-built Panamax vessel of 74,759 dwt, to an unrelated third party for a net sale price of $12.7 million. The sale is expected to be completed during the third quarter of 2021.
Current Fleet
Following the above transactions, on a fully delivered basis, our fleet would consist of 98 vessels, 55 dry bulk vessels and 43 containerships with a total capacity of 9.3 million dwt.
Financing Update
In March 2021, Navios Partners entered into a new credit facility with a commercial bank for a total amount of $58.0 million in order to refinance two dry bulk vessels and to finance the acquisition of the Navios Avior and the Navios Centaurus. The credit facility has an amortization profile of 8.8 years, matures in March 2026 and bears interest at LIBOR plus 3.0% per annum.
In January and March 2021, Navios Partners entered into bareboat charter-in agreements for four Japanese newbuilding Capesize vessels. The total implied amount financed for the three vessels is approximately $144.0 million and for the fourth is approximately $48.0 million and the implied effective interest rate is 4.4% and 5.0%, respectively.
In April 2021, Navios Partners entered into a new credit facility with a commercial bank for a total amount of $40.0 million in order to refinance the existing facility of two dry bulk vessels and to finance the acquisition of two containerships. The facility has an amortization profile of seven years, matures in the second quarter of 2025 and bears interest at LIBOR plus 2.85% per annum.
In April 2021, Navios Partners entered into a new credit facility with a commercial bank for a total amount of $8.9 million in order to finance the acquisition of one containership. The facility has an amortization profile of approximately seven years, matures in the fourth quarter of 2024 and bears interest at LIBOR plus 3.0% per annum.
In May 2021, Navios Partners entered into a new credit facility with a commercial bank for a total amount of up to $160.0 million in order to: (i) refinance its existing facility maturing in August 2021; (ii) refinance one dry bulk vessel; and (iii) finance the acquisition of one dry bulk vessel. The new facility has an amortization profile of approximately eight years, matures in the second quarter of 2025 and bears interest at LIBOR plus 3.10% per annum.
In June 2021, Navios Partners entered into a new credit facility with a commercial bank for a total amount of up to $43.0 million, in order to refinance the existing credit facilities of six dry bulk vessels. The facility has an amortization profile of approximately eight years, matures in the second quarter of 2026 and bears interest at LIBOR plus 300 bps per annum.
As discussed above, in June 2021, Navios Partners entered into a bareboat charter-in agreement for one Japanese newbuilding Capesize vessel. The implied amount financed for the vessel is approximately $48.0 million and the implied effective interest rate is 4.3%.
In June 2021, Navios Partners completed an $18.5 million sale and leaseback transaction with an unrelated third party, for a 2012-built Capesize vessel. The sale and leaseback transaction has a duration of nine years and an implied fixed interest rate of approximately 5.8%. Navios Partners has the option to buy the vessel at maturity.
In June 2021, Navios Partners completed a $15.0 million sale and leaseback transaction with an unrelated third party, for a 2009-built Capesize vessel. The sale and leaseback transaction has a duration of six years and an implied fixed interest rate of approximately 6.1%. Navios Partners has the option to buy the vessel at maturity.
In July 2021, Navios Partners agreed to enter into a $15.0 million sale and leaseback transaction with an unrelated third party, for a 2009-built Capesize vessel. The sale and leaseback transaction has a duration of six years and an implied fixed interest rate of approximately 6.1%. Navios Partners has the option to buy the vessel at maturity. The transaction remains subject to completion of definitive documentation and is expected to close in the third quarter of 2021. No assurance can be provided that the transaction will be completed in full or in part.
In July 2021, Navios Partners agreed to enter into a new credit facility with a commercial bank for a total amount of up to $18.0 million in order to finance the acquisition of one dry bulk vessel. The new facility will have an amortization profile of seven years and will mature in the third quarter of 2026 and will bear interest at LIBOR plus 2.85% per annum. The facility remains subject to completion of definitive documentation and is expected to close in the third quarter of 2021. No assurance can be provided that the transaction will be completed in full or in part.
Cash Distribution
The Board of Directors of Navios Partners declared a cash distribution for the second quarter of 2021 of $0.05 per unit. The cash distribution is payable on August 12, 2021 to all unitholders of record as of August 9, 2021. The declaration and payment of any further dividends remain subject to the discretion of the Board of Directors and will depend on, among other things, Navios Partners’ cash requirements as measured by market opportunities and restrictions under its credit agreements and other debt obligations and such other factors as the Board of Directors may deem advisable.
Long-Term Cash Flow
Navios Partners has entered into medium to long-term time charter-out agreements for its vessels with a remaining average term of approximately 1.5 years. Navios Partners has currently contracted out 85.8% of its available days for the second half of 2021, 44.0% for 2022 and 25.6% for 2023, including index-linked charters. Excluding index-linked charters, Navios Partners expects to generate revenues of approximately $230.5 million, $349.0 million and $230.7 million, respectively. The average contracted daily charter-out rate for the fleet is $22,919 for the second half of 2021, $30,091 for 2022 and $32,420 for 2023.
Three month periods ended June 30, 2021 and 2020
Time charter and voyage revenues of Navios Partners for the three month period ended June 30, 2021 increased by approximately $105.5 million, or 226.6%, to $152.0 million, as compared to $46.5 million for the same period in 2020. The increase in revenue was mainly attributable to the increase in the size of our fleet and to the increase in Time Charter Equivalent (“TCE”) rate. For the three month period ended June 30, 2021, TCE rate increased by 81.2% to $20,296 per day, as compared to $11,202 per day in the same period in 2020. The available days of the fleet increased by 79.7% to 7,242 days for the three month period ended June 30, 2021, as compared to 4,029 in the same period in 2020.
EBITDA of Navios Partners for the three month period ended June 30, 2020 was affected by items described in the table above. Excluding these items, Adjusted EBITDA increased by approximately $76.1 million to $90.4 million for the three month period ended June 30, 2021, as compared to $14.3 million for the same period in 2020. The increase in Adjusted EBITDA was primarily due to a: (i) $105.5 million increase in time charter and voyage revenues; and (ii) $0.7 million decrease in equity in net loss of affiliate companies recorded in the second quarter of 2020. The above increase was partially mitigated by: (i) a $19.8 million increase in vessel operating expenses, mainly due to the increased fleet; (ii) a $3.9 million increase in time charter voyage expenses; (iii) a $3.3 million increase in general and administrative expenses, mainly due to the increased fleet; (iv) a $2.8 million increase in other expense, net; and (v) an approximately $0.3 million increase in direct vessel expenses (excluding the amortization of deferred drydock, special survey costs and other capitalized items).
Net income of Navios Partners for the three month period ended June 30, 2021 was approximately $99.9 million as compared to $14.6 million net loss for the same period in 2020. Net income for the three month period ended June 30, 2020, was affected by items described in the table above. Excluding these items, adjusted net income for the three month period ended June 30, 2021 amounted to $99.9 million as compared to $7.8 million loss for the three month period ended June 30, 2020. The increase in adjusted net income of approximately $107.8 million was due to: (i) an approximately $76.1 million increase in Adjusted EBITDA; (ii) a $42.0 million income from the amortization of the unfavorable lease terms recorded in the three month period ended June 30, 2021; and (iii) a $0.6 million increase in interest income. The above increase was partially mitigated by: (i) an $8.5 million increase in depreciation and amortization expense; (ii) a $1.4 million increase in amortization for deferred drydock, special survey costs and other capitalized items; and (iii) an approximately $1.0 million increase in interest expense and finance cost.
Six month periods ended June 30, 2021 and 2020
Time charter and voyage revenues of Navios Partners for the six month period ended June 30, 2021 increased by approximately $124.0 million, or 133.3%, to $217.1 million, as compared to $93.0 million for the same period in 2020. The increase in revenue was mainly attributable to the increase in the size of our fleet and to the increase in TCE rate. For the six month period ended June 30, 2021, TCE rate increased by 66.8% to $18,276 per day, as compared to $10,957 per day in the same period in 2020. The available days of the fleet increased by 41.4% to 11,494 days for the six month period ended June 30, 2021, as compared to 8,126 in the same period in 2020.
EBITDA of Navios Partners for the six month period ended June 30, 2021 and 2020 was affected by items described in the table above. Excluding these items, Adjusted EBITDA increased by $90.7 million to $124.1 million for the six month period ended June 30, 2021, as compared to $33.4 million for the same period in 2020. The increase in Adjusted EBITDA was primarily due to an approximate $124.0 million increase in time charter and voyage revenues. The above increase was partially mitigated by a: (i) $20.6 million increase in vessel operating expenses, mainly due to the increased fleet; (ii) $4.1 million increase in general and administrative expenses, mainly due to the increased fleet; (iii) $3.6 million increase in other expense, net; (iv) $3.3 million increase in time charter voyage expenses; (v) $1.0 million equity in net earnings of affiliate companies, recorded in the first half of 2020; (vi) $0.5 million net loss on sale of vessels; and (vii) $0.2 million increase in direct vessel expenses (excluding the amortization of deferred drydock, special survey costs and other capitalized items).
Net income of Navios Partners for the six month period ended June 30, 2021 was approximately $236.6 million as compared to $25.4 million net loss for the same period in 2020. Net income was affected by items described in the table above. Excluding these items, adjusted net income for the six month period ended June 30, 2021 amounted to $111.7 million compared to $11.7 million loss for the six month period ended June 30, 2020. The increase in adjusted net income of approximately $123.4 million was due to a: (i) $90.7 million increase in Adjusted EBITDA; (ii) $42.0 million income from the amortization of the unfavorable lease terms recorded in the six month period ended June 30, 2021; and (iii) $0.5 million increase in interest income. The above increase was partially mitigated by: (i) a $7.9 million increase in depreciation and amortization expense; and (ii) an approximately $1.9 million increase in amortization for deferred drydock, special survey costs and other capitalized items.
View Full Report
EuroDry Ltd. Looking Forward To Strong Dry Bulk Market in 2021, As Fundamentals Keep Improving
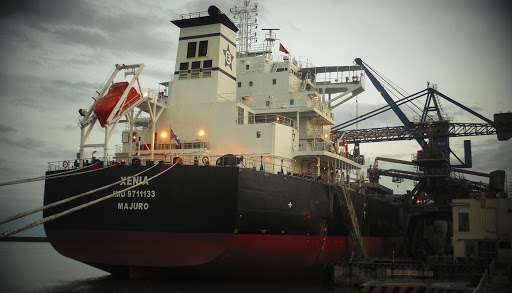
EuroDry Ltd., an owner and operator of drybulk vessels and provider of seaborne transportation for drybulk cargoes, announced its results for the three- and twelve-month periods ended December 31, 2020.
Full Year 2020 Highlights:
• Total net revenues of $22.3 million.
• Net loss of $5.9 million; net loss attributable to common shareholders (after a $1.6 million dividend on Series B Preferred Shares) of $7.5 million or $3.28 loss basic and diluted. Adjusted net loss attributable to common shareholders1 for the period was $6.9 million or $3.04 adjusted loss per share basic and diluted.
• Adjusted EBITDA was $3.7 million.
• An average of 7.0 vessels were owned and operated during the twelve months of 2020 earning an average time charter equivalent rate of $9,387 per day.
Fourth Quarter 2020 Highlights:
• Total net revenues of $6.4 million.
• Net loss of $0.3 million; net loss attributable to common shareholders (after a $0.4 million dividend on Series B Preferred Shares) of $0.7 million or $0.31 loss per share basic and diluted. Adjusted net loss attributable to common shareholders1 for the period was $0.8 million or $0.34 adjusted loss per share basic and diluted.
• Adjusted EBITDA1 was $1.8 million.
• An average of 7.0 vessels were owned and operated during the fourth quarter of 2020 earning an average time charter equivalent rate of $10,761 per day.
• The Company declared a dividend of $0.4 million on its Series B Preferred Shares. The dividend will be paid in-kind by issuing additional Series B Preferred Shares.
1 Adjusted EBITDA, Adjusted net income/(loss) and Adjusted earnings/(loss) per share are not recognized measurements under US GAAP (GAAP) and should not be used in isolation or as a substitute for EuroDry’s financial results presented in accordance with GAAP. Refer to a subsequent section of the Press Release for the definitions and reconciliation of these measurements to the most directly comparable financial measures calculated and presented in accordance with GAAP.
Recent developments
• In January 2021, the Company refinanced the outstanding loans of two of its vessels, M/V Alexandros and M/V Xenia, with a new loan of $26.7 million which, after repaying the outstanding loans of the vessels, resulted in approximately $3.9 million of additional funds available to the Company. The loan is to be repaid in 24 quarterly installments of $0.5 million along with a balloon payment of $14.7 million to be paid together with the last installment.
• In January and February 2021, the Company redeemed a net amount of $3 million of its Series B Preferred Shares (“Preferred Shares”) and, contemporaneously, agreed with its preferred shareholders to reduce the dividend rate of its Preferred Shares to 8% per annum for two years from the 14% per annum level it was set to increase on January 29, 2021. Over the next two years, the Company has also the option to pay the preferred dividends in kind at a rate of 9%. The dividend will reset to 14% per annum in January 2023. The partial redemption and the reduction of the dividend rate for two years would result in about $0.50 per share higher earnings per year over the next two years and $0.18 higher earnings per share thereafter.
• The Company has agreed to refinance the outstanding loan of M/V Eirini P with a loan of $5 million which, after repaying the outstanding loan of the vessel, will result in approximately $1.6 million of additional funds available to the Company. The loan will be repaid in 20 quarterly instalments of $0.21 million along with a balloon payment of $0.8 million to be paid together with the last installment. The loan is subject to customary documentation and is expected to be finalized in February 2021.
Aristides Pittas, Chairman and CEO of EuroDry, commented:“During the fourth quarter of 2020 and especially in the beginning of 2021, the drybulk market improved gradually and reached levels last seen in the fall of 2019 just before the COVID-19 pandemic took center stage. Given the historically low orderbook, at only about 6% of the existing fleet, and the expected rebound of drybulk seaborne trade as vaccines help control COVID-19, we anticipate economic fundamentals that would support a strong charter market throughout 2021. We believe, our fleet is well positioned to take advantage of the higher market rates as the equivalent of 85% of our fleet is exposed to market. Our fourth quarter results were influenced by the scheduled drydocking of M/V Xenia the cost of which was a contributing factor in the quarter’s loss; with no drydockings scheduled within this year and assuming charter rates remain near current levels, we would expect a meaningfully profitable year during 2021.
“At the same time, our increased liquidity, following our recent debt refinancings and preferred shares dividend rate reduction, allows us to pursue some of our fleet expansion plans. As always, we are looking at the capital markets, private and public, to fund our broader growth strategy which includes taking advantage of our public listing to provide a consolidation platform for other owners and fleets.”
Tasos Aslidis, Chief Financial Officer of EuroDry, commented: “Comparing our results for the fourth quarter of 2020 with the same period of 2019, our net revenues decreased by about $1.2 million, due to the lower time charter equivalent rates our vessels earned as compared to the fourth quarter of 2019.
“Total daily vessel operating expenses, including management fees, general and administrative expenses, but excluding drydocking costs, increased by approximately 5.1% during the fourth quarter of 2020 compared to the same quarter of last year, while for the full year 2020 we had an increase of approximately 5.8%. This increase is mainly due to increased supply of stores and spare parts for our vessels in 2020 compared to 2019 and increased crewing costs, the latter resulting from difficulties in crew rotation due to COVID-19 related restrictions. As always, we want to emphasize that cost control remains a key component of our strategy.
“Adjusted EBITDA during the fourth quarter of 2020 was $1.8 million compared to $3.8 million achieved for the fourth quarter of last year. As of December 31, 2020, our outstanding debt (excluding the unamortized loan fees) was $51.4 million versus restricted and unrestricted cash of approximately $4.6 million.”
Fourth Quarter 2020 Results:
For the fourth quarter of 2020, the Company reported total net revenues of $6.4 million representing a 15.7% decrease over total net revenues of $7.6 million during the fourth quarter of 2019 which was the result of the decreased average time charter equivalent rate our vessels earned in the fourth quarter of 2020 compared to the same period of 2019. The Company reported a net loss for the period of $0.3 million and a net loss attributable to common shareholders of $0.7 million, as compared to net income of $1.4 million and net income attributable to common shareholders of $1.0 million for the same period of 2019. Gain on derivatives of $0.03 million and drydocking expenses of $0.5 million contributed to the result for the quarter as compared to gain on derivatives of $0.2 million and drydocking expenses of $0.07 million during the fourth quarter of 2019. Depreciation expenses for the fourth quarter of 2020 amounted to $1.65 million, remaining unchanged compared to the same period of 2019.
Interest and other financing costs for the fourth quarter of 2020 amounted to $0.5 million compared to $0.8 million for the same period of 2019. Interest during the fourth quarter of 2020 was lower due to lower debt during the period and the decreased Libor rates of our loans during the period as compared to the same period of last year.
On average, 7.0 vessels were owned and operated during the fourth quarter of 2020 earning an average time charter equivalent rate of $10,761 per day compared to 7.0 vessels in the same period of 2019 earning on average $12,439 per day.
Adjusted EBITDA for the fourth quarter of 2020 was $1.8 million compared to $3.8 million achieved during the fourth quarter of 2019.
Basic and diluted loss per share attributable to common shareholders for the fourth quarter of 2020 was $0.31 calculated on 2,285,601 basic and diluted weighted average number of shares outstanding, compared to basic and diluted earnings per share of $0.45 for the fourth quarter of 2019, calculated on 2,261,103 basic and diluted weighted average number of shares outstanding.
Excluding the effect on the loss attributable to common shareholders for the quarter of the unrealized (gain)/ loss on derivatives, the adjusted loss attributable to common shareholders for the quarter ended December 31, 2020 would have been $0.34 per share basic and diluted compared to adjusted earnings of $0.43 per share basic and diluted for the quarter ended December 31, 2019. Usually, security analysts do not include the above item in their published estimates of earnings per share.
Full Year 2020 Results:
For the full year of 2020, the Company reported total net revenues of $22.3 million representing a 18.2% decrease over total net revenues of $27.2 million during the twelve months of 2019, as a result of the decreased average time charter equivalent rate our vessels earned in the twelve months of 2020 compared to the same period of 2019. The Company reported a net loss for the period of $5.9 million and a net loss attributable to common shareholders of $7.5 million, as compared to net income for the period of $0.02 million and a net loss attributable to common shareholders of $1.9 million, for the twelve months of 2019. For the twelve months of 2020, a gain on bunkers resulted in decreased voyage expenses of $0.3 million for the period as compared to voyage expenses of $1.1 million in the same period of 2019. Vessel operating expenses were $11.6 million for the twelve months of 2020 as compared to $10.8 million for the same period of 2019, mainly due to increased supply of stores and spare parts for our vessels in 2020 compared to 2019 and increased crewing costs resulting from difficulties in crew rotation due to COVID-19 related restrictions. Depreciation expenses for the twelve months of 2020 were $6.6 million compared to $6.5 million during the same period of 2019. Interest and other financing costs for the twelve months of 2020 amounted to $2.3 million compared to $3.5 million for the same period of 2019. This decrease is due to lower average outstanding debt in the twelve months of 2020 compared to 2019 and the decreased Libor rates of our loans in 2020 compared to the previous year.
On average, 7.0 vessels were owned and operated during the twelve months of 2020 earning an average time charter equivalent rate of $9,387 per day compared to 7.0 vessels in the same period of 2019 earning on average $11,190 per day. In the twelve months of 2020, three vessels underwent special survey for a total cost of $2.3 million, as compared to two vessels that underwent special survey and one vessel that underwent an intermediate survey for a total cost of $1.7 million in the twelve months of 2019. For the twelve months of 2020, the Company recognized a $0.5 million loss on three interest rate swaps and a $0.3 million loss on FFA contracts as compared to a gain on derivatives of $0.5 million for the same period of 2019, comprising of a $0.8 million gain on FFA contracts and a $0.3 million loss on one interest rate swap.
Adjusted EBITDA for the twelve months of 2020 was $3.7 million compared to $10.3 million achieved during the twelve months of 2019.
Basic and diluted loss per share attributable to common shareholders for the twelve months of 2020 was $3.28, calculated on 2,275,062 basic and diluted weighted average number of shares outstanding compared to basic and diluted loss of $0.85 per share for the twelve months of 2019, calculated on 2,251,439 basic and diluted weighted average number of shares outstanding.
Excluding the effect on the loss attributable to common shareholders for the year of the unrealized (gain) / loss on derivatives, the adjusted loss attributable to common shareholders for the year ended December 31, 2020 would have been $3.04 per share compared to a loss of $0.69 per share basic and diluted for 2019. As previously mentioned, usually, security analysts do not include the above item in their published estimates of earnings per share.
View Full Report
Globus Maritime Limited Expects Significant Dry Bulk Market Recovery During 2021 and 2022
Globus Maritime Limited, a dry bulk shipping company, reported its unaudited consolidated operating and financial results for the quarter and nine-month period ended September 30, 2020.
– As of September 30, 2020 the Total Assets of the Company were $76.4 million compared to $55.7 million as of December 31, 2019, an increase of 37%.
– As of September 30, 2020 and December 31, 2019, our cash and bank balances and bank deposits (including restricted cash) were $31.2 and $4.8 million respectively, an increase of 550%.
– As of September 30, 2020 the Total Liabilities of the Company (including Total Debt) were $42.4 million compared to $45.8 million as of December 31, 2019, a decrease of 7%.
– For the nine-month period ended September 30, 2020 the average operating expenses decreased to $4,422, per vessel/per day, compared to $4,943 for the same period in 2019, a decrease of 11%.
Current Fleet Deployment
All our vessels are currently operating on short-term time charters (“on spot”).
Management Commentary
“During the third quarter we finally had a glimpse of hope in the market. Rates started to slowly pick up even though there were significant headwinds from the pandemic and the ongoing trade war. The company achieved a high fleet utilization rate while it kept the costs under control and managed to return with positive adjusted EBITDA figures.
We remain optimistic that the dry bulk industry will improve significantly in 2021 and 2022. As the world returns to some form of normality, trade and world GDP are expected to surge dramatically. What is interesting to see at this point in the industry is the historically low order book for new vessels; this means that the increase of new supply introduced in our industry will be also low. These two factors, the increase in world trade activity coupled with the low order book, should increase the worldwide fleet utilization and by extent pressure rates upwards.
In the 3rd Quarter we continued to focus on improving our balance sheet and have remained alert to opportunities for growth. It is along these lines that we completed, as previously announced, an asset acquisition and have taken delivery of a new vessel in October. This is the main theme for the rest of 2020 and the Company is ready to fully take advantage of what we think is going to be an exciting future for our industry. At present, we are looking at several financing options to further expand our fleet in order to fully leverage the operational and technical expertise the company provides.”
Management Discussion and Analysis of the Results of Operations
Recent Developments
Convertible Note
On March 13, 2020, the Company and the holder of the Convertible Note, which is further discussed in the 2019 Annual Report, entered into a waiver regarding the Convertible Note (the “Waiver”). The Waiver waived the Company’s obligation to repay the Convertible Note on the existing maturity date of March 13, 2020 and did not require the Company to repay the Convertible Note until March 13, 2021. The Convertible Note was fully repaid in June 2020.
Firment Shipping Inc.
On May 8, 2020, the Company and Firment Shipping Inc. agreed to enter into an amended and restated agreement. The final maturity of the Firment Shipping Credit Facility was extended to October 31, 2021 and the available amount to be drawn under this Facility increased to $14.2 million. The outstanding amount under the Firment Shipping Credit Facility was fully repaid on July 27, 2020.
Gaining Compliance with NASDAQ Capital Market
On March 6, 2020, the Company received written notification from The Nasdaq Stock Market (“Nasdaq”) dated March 2, 2020, indicating that because the closing bid price of its common stock for the last 30 consecutive business days was below $1.00 per share, the Company no longer met the minimum bid price continued listing requirement for the Nasdaq Capital Market, as set forth in Nasdaq Listing Rule 5450(a)(1). Pursuant to Nasdaq Listing Rules, the applicable grace period to regain compliance is 180 days, or August 31, 2020, but citing extraordinary market conditions, Nasdaq filed an immediately effective rule change with the Securities and Exchange Commission which, with effect from April 16, 2020, tolled the listing process until July 1, 2020. Consequently, the Company’s compliance period has effectively been extended until November 12, 2020.
On October 19, 2020 the Company determined to effect a 1‐for-100 reverse stock split in order to regain compliance with the Nasdaq Capital Market concerning the minimum bid price requirement. On October 21, 2020, the Company had the 1‐for‐100 reverse stock split effected and on November 5, 2020 it received notification from Nasdaq that it had regained compliance with the minimum bid price and the matter is now closed.
The 1-for-100 reverse stock split, reduced number of outstanding common shares from 175,675,651 to 1,756,720 shares (adjustments were made based on fractional shares). Unless otherwise noted, all historical share numbers, per share amounts, including common share, preferred shares and warrants, have been adjusted to give effect to this reverse split.
Issuance of the Series B preferred shares
On June 12, 2020, the Company entered into a stock purchase agreement and issued 50 of our newly-designated Series B Preferred Shares, par value $0.001 per share, to Goldenmare Limited, a company controlled by our Chief Executive Officer, Athanasios Feidakis, in return for $150,000, which amount was settled by reducing, on a dollar-for-dollar basis, the amount payable as executive compensation by the Company to Goldenmare Limited pursuant to a consultancy agreement.
The issuance of the Series B preferred shares to Goldenmare Limited was approved by an independent committee of the Board of Directors of the Company, which received a fairness opinion from an independent financial advisor that the transaction was for a fair value.
Each Series B preferred share entitles the holder thereof to 25,000 votes per share on all matters submitted to a vote of the shareholders of the Company, provided however, that no holder of Series B preferred shares may exercise voting rights pursuant to Series B preferred shares that would result in the aggregate voting power of any beneficial owner of such shares and its affiliates (whether pursuant to ownership of Series B preferred shares, common shares or otherwise) to exceed 49.0% of the total number of votes eligible to be cast on any matter submitted to a vote of shareholders of the Company. To the fullest extent permitted by law, the holders of Series B preferred shares shall have no special voting or consent rights and shall vote together as one class with the holders of the common shares on all matters put before the shareholders. The Series B preferred shares are not convertible into common shares or any other security. They are not redeemable and have no dividend rights. Upon any liquidation, dissolution or winding up of the Company, the Series B preferred shares are entitled to receive a payment with priority over the common shareholders equal to the par value of $0.001 per share. The Series B preferred shareholder has no other rights to distributions upon any liquidation, dissolution or winding up of the Company. All issued and outstanding Series B preferred shares must be held of record by one holder, and the Series B preferred shares shall not be transferred without the prior approval of our Board of Directors. Finally, in the event the Company (i) declares any dividend on its common shares, payable in common shares, (ii) subdivides the outstanding common shares or (iii) combines the outstanding common shares into a smaller number of shares, there shall be a proportional adjustment to the number of outstanding Series B preferred shares.
In July 2020, we issued an additional 250 of our Series B preferred shares to Goldenmare Limited in return for $150,000. The $150,000 was paid by reducing, on a dollar-for-dollar basis, the amount payable as compensation by the Company to Goldenmare Limited pursuant to a consultancy agreement.
In addition, we increased the maximum voting rights under the Series B preferred shares from 49.0% to 49.99%. The issuance of the Series B preferred shares to Goldenmare Limited was approved by an independent committee of the Board of Directors of the Company, which received a fairness opinion from an independent financial advisor that the transaction was for a fair value.
Public Offerings
On June 22, 2020, the Company completed its public offering of 342,857 units of the Company, each unit consisting of one common share and one Class A Warrant to purchase one common share (a “Class A Warrant”), for $35 per unit. At the time of the closing, the underwriters exercised and closed a part of their over-allotment option, and purchased an additional 51,393 Common Shares and 51,393 Class A Warrants.
The pre-funded warrants are exercisable at any time after their original issuance until exercised in full. The Class A Warrants are exercisable at an exercise price of $35 per share at any time after their original issuance up to the date that is five years after their original issuance. Each of the pre-funded warrants and the Class A Warrants will be exercisable, in whole or in part by delivering to us a duly executed exercise notice and, at any time a registration statement registering the issuance of the common shares underlying the warrants under the Securities Act is effective and available for the issuance of such shares, by payment in full in immediately available funds for the number of common shares purchased upon such exercise. If a registration statement registering the issuance of the common shares underlying the warrants under the Securities Act is not effective or available, the holder may, in its sole discretion, elect to exercise the warrant through a cashless exercise, in which case the holder would receive upon such exercise the net number of common shares determined according to the formula set forth in the warrant. The Company may be required to pay certain amounts as liquidated damages as specified in the warrants in the event it does not deliver common shares upon exercise of the warrants within the time periods specified in the warrants.
On June 30, 2020, the Company issued 458,500 of its common shares in a registered direct offering and 458,500 of its June Private Placement (“PP”) Warrants in a concurrent private placement for a purchase price of $27 per common share and June PP Warrant. The exercise price of each June PP Warrant is $30 per share.
The PP Warrants are exercisable for a period of five and one-half years commencing on the date of issuance. The warrants will be exercisable, at the option of each holder, in whole or in part by delivering to us a duly executed exercise notice with payment in full in immediately available funds for the number of common shares purchased upon such exercise. If a registration statement registering the resale of the common shares underlying the private placement warrants under the Securities Act is not effective or available at any time after the six-month anniversary of the date of issuance of the private placement warrants, the holder may, in its sole discretion, elect to exercise the private placement warrant through a cashless exercise, in which case the holder would receive upon such exercise the net number of common shares determined according to the formula set forth in the warrant. If the Company does not issue the shares in a timely fashion, the warrant contains certain liquidated damages provisions.
On July 21, 2020, the Company issued 833,333 of its common shares in a registered direct offering and 833,333 of its July PP Warrants to purchase common shares in a concurrent private placement for a purchase price of $18 per common share and July PP Warrant. The exercise price of each July PP Warrant is $18 per share. Concurrently with this offering the exercise price of the June PP Warrants was reduced to $18 per share.
The PP Warrants are exercisable for a period of five and one-half years commencing on the date of issuance. The warrants will be exercisable, at the option of each holder, in whole or in part by delivering to us a duly executed exercise notice with payment in full in immediately available funds for the number of common shares purchased upon such exercise. If a registration statement registering the resale of the common shares underlying the private placement warrants under the Securities Act is not effective or available at any time after the six-month anniversary of the date of issuance of the private placement warrants, the holder may, in its sole discretion, elect to exercise the private placement warrant through a cashless exercise, in which case the holder would receive upon such exercise the net number of common shares determined according to the formula set forth in the warrant. If the Company does not issue the shares in a timely fashion, the warrant contains certain liquidated damages provisions.
From June 22, 2020 through to date, the Company issued 5,550 common shares pursuant to exercises of outstanding Class A Warrants. As of December 4, 2020, no PP Warrants had been exercised.
Acquisition of new vessel
On October 29, 2020, the Company took delivery of the M/V “Galaxy Globe”, a 2015-built Kamsarmax dry bulk carrier, it acquired for a purchase price of $18.4 million. The M/V “Galaxy Globe” was built at the Hudong-Zhonghua Shipyard in China and has a carrying capacity of 81,167 DWT. Following this acquisition, the fleet of Globus comprises of six dry bulk carriers with a total carrying capacity of 381,738 DWT.
Results of Operations
Third quarter of the year 2020 compared to the third quarter of the year 2019
Total comprehensive loss for the third quarter of the year 2020 amounted to $1.3 million or $0.8 basic and diluted loss per share based on 1,574,877 weighted average number of shares, compared to total comprehensive income of $198 thousand for the same period last year or $4.47 basic and diluted earnings per share based on 44,191 weighted average number of shares.
Navios’ Frangou Optimistic About Dry Bulk Market’s Growth in 2021

Navios Maritime Holdings Inc. (“Navios Holdings” or “the Company”) (NYSE: NM), a global seaborne shipping and logistics company, today reported financial results for the third quarter and nine month period ended September 30, 2020.
Angeliki Frangou, Chairman and Chief Executive Officer, stated, “I am pleased with our results for the third quarter of 2020. During the third quarter, Navios Holdings reported revenue of $126.2 million, adjusted EBITDA of $60.2 million and adjusted Net Income of $2.1 million.”
Angeliki Frangou continued, “Drybulk demand in the first half of 2020 was adversely effected by global quarantines. However, monetary stimulus and other policy measures eased the disruption and helped restart global economies in the third quarter. We believe that continued improvement is also attributable to food security considerations and new purchasing patterns emerging in the pandemic economy. Consequently, we are optimistic about growth in 2021.”
HIGHLIGHTS – RECENT DEVELOPMENTS
Fleet Update
Vessel Sales
In September 2020, the Company sold the Navios Gem, a 2014-built Capesize vessel of 181,336 dwt, and the Navios Victory, a 2014-built Panamax vessel of 77,095 dwt, for a sale price of $51.0 million. Part of the sale proceeds were used for the repayment in full of the $33.0 million of outstanding secured bank debt in respect of the two vessels.
In August and September 2020, the Company sold to unrelated third parties, two 2005-built Panamax vessels, the Navios Northern Star and the Navios Amitie, for sale prices of $7.0 million and $7.1 million, respectively.
Owned fleet renewal and expansion
Over the last twelve months ended Q3 2020 Navios Holdings has added eight vessels to its owned fleet (including vessels under bareboat in agreements) with an average age of 4.1 years. At the same period a total of seven vessels have been sold with an average age of 13.4 years. The above had a result of increasing the dwt capacity of the owned vessels by 8% and decrease its average age by 13%.
Fleet statistics
Navios Holdings controls a fleet of 49 vessels totaling 5.3 million dwt, of which 32 are owned (including five bareboat-in vessels) and 17 are chartered-in under long-term charters (collectively, the “Core Fleet”). The fleet consists of 16 Capesize, 26 Panamax, five Ultra-Handymax and two Handysize vessels, with an average age of 8.0 years.
Navios Holdings has currently chartered-out 94.4% of available days for the remaining three months of 2020. Of these available days, 71.1% are chartered-out on fixed rate and 23.3% are chartered-out on index.
The average contracted daily charter-in rate for the long-term charter-in vessels (excluding Kliemar controlled fleet mainly used for servicing contracts of affreightment) for the remaining three months of 2020 is $13,011 per day. The above figures do not include the fleet of Navios South American Logistics Inc. (“Navios Logistics”).
Exhibit II provides certain details of the Core Fleet of Navios Holdings. It does not include the fleet of Navios Logistics.
Non-GAAP Measures
EBITDA, Adjusted EBITDA, Adjusted Net Income/(Loss) attributable to Navios Holdings’ common stockholders and Adjusted Basic Earnings/(Loss) attributable to Navios Holdings’ common stockholders per share are non-U.S. GAAP financial measures and should not be used in isolation or as substitution for Navios Holdings’ results calculated in accordance with U.S. GAAP.
See Exhibit I under the heading, “Disclosure of Non-GAAP Financial Measures,” for a discussion of EBITDA, Adjusted EBITDA, Adjusted Net Income/(Loss) attributable to Navios Holdings’ common stockholders and Adjusted Basic Earnings/(Loss) attributable to Navios Holdings’ common stockholders per share of Navios Holdings (including Navios Logistics), and EBITDA of Navios Logistics (on a stand-alone basis) and a reconciliation of such measures to the most comparable measures calculated under U.S. GAAP.
As of November 30, 2018, Navios Holdings obtained control over Navios Maritime Containers L.P. (“Navios Containers”) and consequently consolidated Navios Containers beginning on that date. Following the sale of Navios Containers general partnership interest on August 30, 2019, Navios Holdings deconsolidated Navios Containers from that date onwards. The results of operations of Navios Containers for the three and nine month periods ended September 30, 2019 consolidated under Navios Holdings have been reported as discontinued operations.
Revenue from dry bulk vessel operations for the three month period ended September 30, 2020 decreased by $10.1 million, or 13.0%, to $67.4 million, as compared to $77.5 million for the same period during 2019. The decrease in dry bulk revenue was mainly attributable to the decline in the time charter and freight market during the periods compared and a decrease in available days by 2.9%, due to the vessels sold and certain charter-in vessels that were redelivered, partially mitigated by the delivery of the five bareboat-in vessels. The TCE per day decreased by 9.5% to $14,056 per day in the third quarter of 2020, as compared to $15,534 per day in the same period of 2019.
Revenue from the Logistics Business was $58.8 million for the three month period ended September 30, 2020, as compared to $64.1 million for the same period in 2019. The decrease was mainly attributable to (i) a $4.4 million decrease in revenue from the port terminal business, mainly attributable to lower volumes transshipped from the grain port terminal, (ii) a $2.9 million decrease in revenue from the barge business, mainly due to less revenue from time charter contracts and (iii) a $1.0 million decrease in revenue from the cabotage business mainly, due to lower time charter rates. The overall decrease was partially mitigated by a $3.0 million increase in sales of products due to the increase in the Paraguayan liquid port’s volume of products sold.
Net Loss attributable to Navios Holdings’ common stockholders was $10.1 million for the three month period ended September 30, 2020, as compared to $39.1 million for the same period in 2019. Net Loss attributable to Navios Holdings’ common stockholders was affected by items described in the table above. Excluding these items, Adjusted Net Income attributable to Navios Holdings’ common stockholders for the three month period ended September 30, 2020 was $2.1 million, as compared to $35.7 million for the same period in 2019. This decrease in Adjusted Net Income was mainly due to (i) a $29.7 million decrease in Adjusted EBITDA as discussed in the paragraph below; (ii) a $6.9 million increase in interest expense and finance cost, net; and (iii) a $0.2 million increase in income tax expense. This overall decrease of $36.8 million was partially mitigated by (i) a $2.2 million decrease in depreciation and amortization; (ii) a $0.5 million decrease in share-based compensation expense; and (iii) a $0.5 million decrease in amortization for deferred drydock and special survey costs.
Net Income of Navios Logistics, on a standalone basis, was $2.7 million for the three month period ended September 30, 2020, as compared to $14.3 million for the same period in 2019.
Excluding $4.2 million in write-off of deferred finance cost for bond extinguishment incurred for the three month period ended September 30, 2020, Adjusted Net Income of Navios Logistics, on a standalone basis, was $6.8 million for the three month period ended September 30, 2020, as compared to $14.3 million for the same period in 2019.
Net Loss of Navios Containers, on a standalone basis, was $0.8 million for the period from July 1, 2019 to August 30, 2019 (deconsolidation effective date).
Adjusted EBITDA of Navios Holdings for the three month period ended September 30, 2020 decreased by $29.7 million to $60.2 million, as compared to $89.9 million for the same period in 2019. The decrease in Adjusted EBITDA was primarily due to (i) a $15.4 million decrease in revenue; (ii) a $12.4 million decrease in gain on bond extinguishment; (iii) a $9.8 million gain on sale of business recorded in the three month period ended September 30, 2019; (iv) a $4.5 million decrease in other income, net; and (v) a $1.3 million increase in direct vessel expenses (excluding the amortization of deferred drydock and special survey costs). This overall decrease of $43.4 million was partially mitigated by (i) a $6.5 million decrease in time charter, voyage and logistics business expenses; (ii) a $3.4 million decrease in net income attributable to the noncontrolling interest; (iii) a $2.3 million decrease in general and administrative expenses (excluding share-based compensation expenses); and (iv) a $1.5 million increase in equity in net earnings from affiliate companies.
EBITDA of Navios Logistics, on a standalone basis, was $24.2 million for the three month period ended September 30, 2020, as compared to $32.5 million for the same period in 2019. Excluding $4.2 million in write-off of deferred finance cost for bond extinguishment incurred for the three month period ended September 30, 2020, Adjusted EBITDA of Navios Logistics, on a standalone basis, was $28.3 million for the three month period ended September 30, 2020, as compared to $32.5 million for the same period in 2019.
Nine Months Ended September 2020 and 2019 Results (in thousands of U.S. dollars, except per share data and unless otherwise stated):Revenue from dry bulk vessel operations for the nine month period ended September 30, 2020 decreased by $43.1 million, or 23.5%, to $140.0 million, as compared to $183.1 million for the same period in 2019. The decrease in dry bulk revenue was mainly attributable to the decline in the time charter and freight market during the periods compared, and a decrease in available days by 8.5%, due to the vessels sold and certain charter-in vessels that were redelivered, partially mitigated by the delivery of the five bareboat-in vessels. The TCE per day decreased by 17.9% to $9,673 per day in the nine month period ended September 20, 2020, as compared to $11,784 per day in the same period in 2019.
Revenue from the Logistics Business was $174.4 million for the nine month period ended September 30, 2020 as compared to $180.5 million for the same period in 2019. The decrease was mainly attributable to (i) a $7.3 million decrease in revenue from the barge business, mainly due to less revenue from time charter contracts, (ii) a $3.2 million decrease in revenue from the port terminal business, mainly attributable to lower volumes transshipped from the grain port terminal and (iii) a $1.7 million decrease in revenue from the cabotage business, mainly due to lower time charter rates. The overall decrease was partially mitigated by a $6.0 million increase in sales of product, due to an increase in the Paraguayan liquid port’s volumes of products sold.
Net Loss attributable to Navios Holdings’ common stockholders was $98.6 million for the nine month period ended September 30, 2020, as compared to $80.9 million for the same period in 2019. Net Loss attributable to Navios Holdings’ common stockholders was affected by items described in the table above. Excluding these items, Adjusted Net Loss attributable to Navios Holdings’ common stockholders for the nine month period ended September 30, 2020 was $46.7 million, as compared to $34.5 million Adjusted Net Income for the same period in 2019. This decrease in Adjusted Net Income was mainly due to (i) a $83.1 million decrease in Adjusted EBITDA as discussed in the paragraph below; and (ii) an $8.9 million increase in interest expense and finance cost, net. This overall decrease of $92.0 million in Adjusted Net Income was partially mitigated by (i) a $8.3 million decrease in depreciation and amortization; (ii) a $1.3 million decrease in share-based compensation expense; (iii) a $0.7 million decrease in amortization for deferred drydock and special survey costs; and (iv) a $0.5 million decrease in income tax expense.
Net Income of Navios Logistics, on a standalone basis, was $21.7 million for the nine month period ended September 30, 2020, as compared to $29.3 million for the same period in 2019.
Excluding $4.2 million in write-off of deferred finance cost for bond extinguishment incurred for the nine month period ended September 30, 2020, Adjusted Net Income of Navios Logistics, on a standalone basis, was $25.9 million for the nine month period ended September 30, 2020, as compared to $29.3 million for the same period in 2019.
Net Loss of Navios Containers, on a standalone basis, was $4.1 million for the period from January 1, 2019 to August 30, 2019 (deconsolidation effective date).
Adjusted EBITDA of Navios Holdings for the nine month period ended September 30, 2020 decreased by $83.1 million to $116.1 million, as compared to $199.2 million for the same period in 2019. The decrease in Adjusted EBITDA was primarily due to (i) a $49.2 million decrease in revenue; (ii) a $24.5 million decrease in other income, net; (iii) a $22.5 million decrease in gain on bond extinguishment; (iv) a $9.8 million gain on sale of business recorded in the nine month period ended September 30, 2019; (v) a $3.1 million increase in direct vessel expenses (excluding the amortization of deferred drydock and special survey costs); and (vi) a $1.3 million increase in net income attributable to the noncontrolling interest. This overall decrease of $110.4 million was partially mitigated by (i) a $17.4 million increase in equity in net earnings from affiliate companies; (ii) a $9.0 million decrease in time charter, voyage and logistics business expenses; and (iii) a $0.9 million decrease in general and administrative expenses (excluding share-based compensation expenses).
EBITDA of Navios Logistics, on a standalone basis, was $73.4 million for the nine month period ended September 30, 2020, as compared to $84.2 million for the same period in 2019. Excluding $4.2 million in write-off of deferred finance cost for bond extinguishment incurred for the nine month period ended September 30, 2020, Adjusted EBITDA of Navios Logistics, on a standalone basis, was $77.5 million for the nine month period ended September 30, 2020, as compared to $84.2 million for the same period in 2019.
View Full Report
Seanergy Maritime Holdings Corp. Expects Strong Dry Bulk Market Rebound in Post-COVID Era
Seanergy Maritime Holdings Corp. announced yesterday its financial results for the third quarter and nine months ended September 30, 2020.
For the quarter ended September 30, 2020, the Company generated net revenues after voyage expenses of $15.8 million, compared to $15.9 million in the corresponding quarter of 2019. This compares favorably with the 29% decrease in the average Capesize spot earning s in the third quarter of 2020 versus the same quarter of 2019. Accordingly, the average Time Charter Equivalent (“TCE”)1 earned by the fleet during the third quarter of 2020 was $16,219 per vessel per day, a decrease of 19% from $20,143 in the third quarter of 2019. Seanergy recorded net income of $3.6 million in the third quarter, compared to net income of $0.7 million in the same quarter of 2019. Basic net income per share for the third quarter of 2020 was $0.08. During the quarter, the Company recognized a $5.2 million gain from the refinancing of a loan facility at a discount through a new loan facility provided by a third-party lender.
For the nine-month period ended September 30, 2020 net revenues after voyage expenses amounted to $28.1 million, an 8.5% decrease compared to $30.7 million in the same period of 2019. The TCE earned during the first nine months of 2020 was $10,267, representing a 14% decrease from $12,004 in the same period of 2019, on the back of the historically low earnings environment of the first half of 2020.
Cash and cash-equivalents, including restricted cash, as of September 30, 2020 stood at $33.8 million, increased from $14.6 million as of December 31, 2019. Shareholders’ equity at the end of the third quarter of 2020 was $86.5 million compared to $29.9 million at the end of 2019. Third party vessel-secured debt was $160.1 million at the end of the third quarter of 2020 as compared to $183.1 million as of December 31, 2019.
Stamatis Tsantanis, the Company’s Chairman and Chief Executive Officer, stated:
“We are very pleased to see the third quarter of 2020 turning profitable for Seanergy following one of the worst six-month periods in recent history of our market. The Capesize daily rates improved significantly compared to the historically low first half of the year and that was reflected in the operating performance of our fleet. Our TCE for the third quarter was $16,219, improved by 132% from $6,985 in the first six months of 2020. The main factors behind the recent rate improvement were the increased demand for iron ore in China and the continued recovery in Brazilian exports. Our commercial performance in the fourth quarter tracks the BCI index which has averaged at approximately $20,500 quarter-to-date.
Despite the global short-term uncertainties, we expect this positive trend to continue in the long run, given the increasing demand of commodities combined with the lowest Capesize newbuilding orderbook of the last 15 years. Seanergy is the only pure-play Capesize company publicly listed in the US and is well-positioned to capitalize on positive market fundamentals. Our balanced commercial approach between index-linked time-charters and spot market exposure and our improved balance sheet offer a strong competitive advantage.
The COVID-19 global pandemic has affected the shipping industry and the seafarers onboard our vessels as port restrictions imposed globally have posed challenges on the timing and efficacy of crew changes. Through our meticulous planning we have been able to source solutions for our crew members despite the global travel restrictions. Our focus continues to be to safeguard the well-being of our onshore employees and crew members, avoid disruptions in the day-to-day vessel operations and service our clients efficiently.
In light of volatile market conditions, we took actions during the first nine months of 2020 to preserve our liquidity and strengthen our balance sheet. As a result of these actions, vessel-secured debt has seen an impressive reduction of $23 million since the end of 2019, while our trade credit position has improved by approximately $11.2 million in the same period. Further to the normal amortization of our senior facilities which was met in full, the reduction in our third-party debt was supported by the refinancing of two vessels at a discount, which resulted in a $5.2 million gain. We remain in discussions with our lenders regarding our loan facilities expiring in 2020, and have received positive feedback from our senior lenders to date, as described further in this release.
Furthermore, within the third quarter of 2020, we have taken delivery of our eleventh Capesize vessel, a 2005 built Japanese unit, which we agreed to acquire in the second quarter of the year at what we believe to be a historical low price. Despite the challenges faced globally in shipping, the delivery was concluded successfully during a rising market.
Concluding, despite the challenging operating environment imposed by the evolving pandemic, we have managed to strongly position Seanergy in a prominent position for what we believe will be a strong market rebound in the post COVID-19 era. Our strategic targets of sustainable growth and capital structure improvement, as means to achieve improved returns for our shareholders, continue to be in the foreground of all our initiatives.”
View Full Report
Star Bulk Carriers Corp. Optimistic About Dry Bulk Market Fundamentals During Second Half of 2020
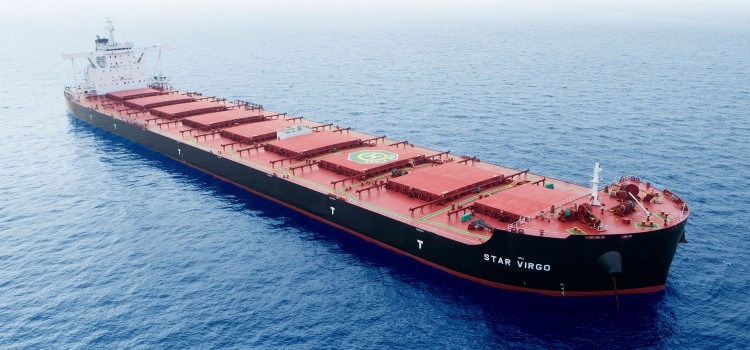
Star Bulk Carriers Corp., a global shipping company focusing on the transportation of dry bulk cargoes, announced its unaudited financial and operating results for the second quarter and the first half of 2020.
Petros Pappas, Chief Executive Officer of Star Bulk, commented:
“Star Bulk announced today its second quarter 2020 financial results, reporting TCE Revenues of $97.1 million, Adjusted EBITDA of $35.1 million, Net loss of $44.1 million and Adjusted Net Loss of $18.1 million during a period of unprecedented volatility. Our average TCE for the quarter, decreased to $9,402/ day per vessel, while daily Opex and Net Cash G&A expenses per vessel were $4,027/day and $1,048/day respectively. As of today, we have physical coverage of 60% of Q3 2020 days at an average TCE rate of $12,145/ day.
We continue taking proactive steps to strengthen our balance sheet via refinancings that improve our Company’s liquidity. Despite the challenging market conditions, there has been significant interest from our lenders to engage with Star Bulk in new transactions. To date we have completed transactions that have increased our cash balance by $37.4 million and have received credit committee approval for another $75.0 million of expected net proceeds that will be finalized over the next two months.
We are optimistic about market fundamentals for the remainder of the year. There is a record low orderbook as a result of recent demand shocks and the uncertainty related to future decarbonization regulations. Dry bulk trade and ton-miles are expected to recover, propelled by the global infrastructure stimulus response to Covid19, which, we expect, will lead to a better balanced dry bulk market“
Recent Developments
Financing Activities
In July 2020, we drew down $155.3 million in aggregate under the (i) ING $70.0 million Facility, (ii) Alpha Bank $35.0 million Facility and (iii) Piraeus Bank $50.4 million Facility, and used this amount to refinance the outstanding amounts under the loan and lease agreements of 14 vessels. The above facilities refinanced facilities with aggregate outstanding amounts of $124.9 million.
In July 2020, we entered into a loan agreement with a wholly owned subsidiary of NTT Finance Corporation for an amount of $17.6 million (the “NTT $17.6 million Facility”). The drawn amount was used to refinance the outstanding lease agreement of the M/V Star Calypso. The facility will mature 5 years from the drawdown date. The NTT $17.6 million Facility is secured by a first priority mortgage on M/V Star Calypso. The above facility refinanced another facility with an outstanding amount of $10.7 million.
In July 2020, we signed a commitment letter with CMBL to sell and leaseback the vessels M/V Laura, M/V Idee Fixe, M/V Roberta, M/V Kaley, M/V Diva, M/V Star Sirius and M/V Star Vega. We expect to receive $89.0 million in aggregate, pursuant to the seven sale and leaseback agreements, which will refinance the outstanding amounts under the loan and lease agreements of the aforementioned vessels. The sale and leaseback agreements are expected to be concluded by the end of August and the lease terms will be for 5 years with a purchase option at the expiration of the bareboat charters term.
In July 2020, we signed a commitment letter with a Japanese financial institution to sell and leaseback the vessel M/V Star Lutas. We expect to receive $16.0 million pursuant to the sale and leaseback agreement, which will refinance the outstanding amount under the loan agreement of the vessel. The sale and leaseback agreement is expected to be concluded by the end of September 2020 and the lease term will be for 7 years with a purchase obligation at the expiration of the bareboat charter term.
In July 2020, we signed a commitment letter with a Chinese financial institution to sell and leaseback three of our Newcastlemax vessels. We expect to receive up to $92.6 million in aggregate, pursuant to the three sale and leaseback agreements, which will refinance the outstanding amount under the loan agreement of the three vessels. The sale and leaseback agreements are expected to be concluded in September 2020 and the lease terms will be for 10 years with a purchase obligation at the expiration of the bareboat charters term.
In July 2020, we signed a commitment letter with SPDB Financial Leasing Co. Ltd to sell and leaseback the vessels M/V Mackenzie, M/V Kennadi, M/V Honey Badger, M/V Wolverine and M/V Star Antares. We expect to receive up to $76.5 million in aggregate, pursuant to the five sale and leaseback agreements, which will refinance the outstanding amount under the loan agreement of the five vessels. The sale and leaseback agreements are expected to be concluded in September 2020 and the lease terms will be for 8 years with a purchase obligation at the expiration of the bareboat charters term.
Should we be able to draw down the full amounts under the above-mentioned debt refinancing transactions, we expect to increase our cash balance further by an aggregate of approximately $75.0 million.
During the second quarter of 2020, we drew down a net amount of $5.4 million under the HSBC Working Capital Facility. As of the date of this press release, $29.6 million is outstanding under this facility.
Scrubber Financing Activities
During the second quarter of 2020 and July 2020, we drew down $15.0 million of scrubber financing under the lease agreements with CMBL. As of today we have completed all scrubber related drawdowns and our scrubber financing balance stands at $118.6 million.
Interest rate derivative contractsAs of the date of this press release, we have agreed to fix the floating LIBOR related component of our interest cost on approximately 66% of our outstanding balance of vessel financings at an average 3-month USD LIBOR rate of 46bps and with an average remaining duration of 3.8 years.
Hedging VLSFO-HSFO spreadAs of the date of this press release, we have hedged approximately 71,000 metric tons of our estimated fuel consumption for the second half of 2020 by selling the 2020 Singapore spread between Very Low-Sulfur Fuel Oil (VLSFO) – High-Sulfur Fuel Oil (HSFO) at an average price of $232 per ton. In addition we have hedged approximately 24,000 metric tons of our estimated fuel consumption by selling the 2021 Singapore spread between VLSFO –HSFO at an average price of $106 per ton.
Other DevelopmentsOn June 4, 2020, the Oslo BORS (“OSE”) granted our request for delisting our shares from the OSE. Our common shares were last listed on the OSE on July 31, 2020 and were delisted on August 3, 2020.
Impact of COVID-19 and our proactive measuresWhile it is still early to fully assess the impact of COVID-19 on our financial condition and operations and on the dry bulk industry in general, we have identified the following adverse effects of the COVID-19 pandemic on our business:
Significant reduction in market charter rates, as a result of the decreased demand for dry bulk commodities and the uncertainty with regard to the timing of a return to more normalized global trade patterns.
Potential adverse impact on asset values reflecting the weaker freight markets environment and lack of liquidity in the second hand market. Star Bulk is fully compliant with all its financial covenants as of end of the first half of 2020.
Significant delays and increased cost associated with crew testing positive on COVID-19, crew rotation, supplying our vessels with spares or other supplies and overhauling or maintenance by attending engineers has been adversely affected by COVID-19 due to travel restrictions and quarantine rules.
The Company has taken proactive measures to ensure the health and wellness of crew and onshore employees while maintaining effective business continuity and the uninterrupted service to our customers.
Our business continuity plans onshore for our global offices in Athens, Limassol, Singapore, New York, Oslo and Manilla, have allowed for an efficient transition to a remote working environment. Additionally, we have also placed a temporary ban on all non-essential travel.
The actual impact of these effects and the efficacy of any measures we take in response to the challenges presented by the COVID-19 will depend on how the outbreak will develop, the duration and extent of the restrictive measures that are associated with COVID-19 and their impact on global economy and trade
Employment Overview
Daily Time Charter Equivalent Rate (“TCE”) and TCE Revenues are non-GAAP measures. Please see the table at the end of this release for a reconciliation to Voyage Revenues, which is the most directly comparable financial measure calculated and presented in accordance with U.S. GAAP, as well as for the definition of the respective measures.
For the second quarter of 2020 our TCE rate was:Capesize / Newcastlemax Vessels: $11,363 per day.Post Panamax / Kamsarmax / Panamax Vessels: $9,703 per day.Ultramax / Supramax Vessels: $6,921 per day.
For first half of 2020 our TCE rate was:Capesize / Newcastlemax Vessels: $13,902 per day.Post Panamax / Kamsarmax / Panamax Vessels: $9,079 per day.Ultramax / Supramax Vessels: $7,501 per day.
Amounts shown throughout the press release and variations in period–on–period comparisons are derived from the actual unaudited numbers in our books and records.
Second Quarter 2020 and 2019 Results
Voyage revenues for the second quarter of 2020 decreased to $146.1 million from $157.8 million in the second quarter of 2019. Adjusted time charter equivalent revenues (“Adjusted TCE Revenues”) (please see the table at the end of this release for the calculation of the Adjusted TCE Revenues) were $96.9 million for the second quarter of 2020, compared to $92.1 million for the second quarter of 2019. Adjusted TCE Revenues were positively impacted by an increase in realized gain on forward freight agreements and bunker swaps of $16.0 million in the second quarter of 2020 from $3.1 million in the second quarter of 2019. However, the negative impact of COVID-19 led to an overall weak dry bulk market environment, which is reflected in the lower TCE rate for the second quarter of 2020 of $9,402 compared to $10,549 for the second quarter of 2019.
For the second quarter of 2020, operating loss was $26.2 million, which includes depreciation of $35.3 million compared to operating loss of $18.4 million for the second quarter of 2019, which included depreciation of $30.0 million. Depreciation increased during the second quarter of 2020 due to the increase in the average number of vessels to 116.0 from 107.2 for the second quarter of 2019 as well as due to the increase in the cost base of our vessels due to the recent installation of scrubber equipment and ballast water management systems on 114 vessels.
For the second quarter of 2020, we had a net loss of $44.1 million, or $0.46 loss per share, basic and diluted, based on 95,797,142 weighted average basic and diluted shares. Net loss for the second quarter of 2019 was $40.2 million, or $0.44 loss per share, basic and diluted, based on 91,841,090 weighted average basic and diluted shares.
Net loss for the second quarter of 2020, included the following significant non-cash items, in addition to the depreciation expense mentioned above:
Stock-based compensation expense of $2.1 million, or $0.02 per share, basic and diluted, recognized in connection with common shares granted to our directors and employees; and
Unrealized loss on forward freight agreements and bunker swaps of $24.1 million, or $0.25 per share, basic and diluted.
Net loss for the second quarter of 2019, included the following significant non-cash items, in addition to the depreciation expense mentioned above:
Stock-based compensation expense of $2.6 million, or $0.03 per share, basic and diluted, recognized in connection with common shares granted to our directors and employees;
Unrealized loss on forward freight agreements and bunker swaps of $4.1 million or $0.04 per share, basic and diluted;
Impairment loss of $3.4 million, or $0.04 per share, basic and diluted, recognized in connection with the agreements signed to sell the vessels Star Anna and Star Gamma;
Loss on bad debt of $1.3 million or $0.01 per basic and diluted share associated with the write‐off of disputed charterer balances; and
Net amortization of the fair value of below and above market acquired time charters of $0.5 million, or $0.01 per share, basic and diluted, associated with time charters attached to vessels acquired. The respective net amortization was recorded as an increase to voyage revenues.
Adjusted net loss for the second quarter of 2020, which excludes certain non-cash items, was $18.1 million, or $0.19 loss per share, basic and diluted, compared to an adjusted net loss for the second quarter of 2019 of $20.5 million, or $0.22 loss per share, basic and diluted.Adjusted EBITDA for the second quarter of 2020, which excludes certain non-cash items was $35.1 million, compared to adjusted EBITDA for the second quarter of 2019 of $31.2 million.For the second quarters of 2020 and 2019, vessel operating expenses were $42.5 million and $39.1 million, respectively. This increase is attributable to the increase in the average number of vessels to 116.0 from 107.2. Our average daily operating expenses per vessel for the second quarter of 2020 and 2019, were $4,027 and $4,004, respectively.
During the second quarter of 2020, we incurred $7.5 million dry docking expenses mainly attributable to nine of our vessels that completed their periodic dry docking surveys within such period. During the second quarter of 2019, we incurred dry docking expenses of $19.0 million mainly attributable to ten of our vessels that completed their periodic dry docking surveys during such period (four of which had commenced in the first quarter of 2019), resulting in expenses of $7.0 million while the remaining $12.0 million were incurred in connection with in-progress and upcoming dry dockings.
General and administrative expenses for the second quarters of 2020 and 2019 were $9.0 million and $9.8 million, respectively. The decrease is mainly attributable to the decrease in stock based compensation expense to $2.1 million in the second quarter of 2020 from $2.6 million in the second quarter of 2019. Management fees for the second quarters of 2020 and 2019 were $4.6 million and $4.1 million, respectively. The increase is attributable to the new management agreements entered into in 2019 in connection with the fleet we acquired during the third quarter of 2019. Our average daily net cash general and administrative expenses per vessel (including management fees) for the second quarters of 2020 and 2019 were $1,048 and $1,009, respectively. Charter-in hire expense for the second quarters of 2020 and 2019 was $5.3 million and $21.8 million, respectively. This decrease is attributable to significantly fewer charter-in days of 360 during the second quarter of 2020 compared to 1,468 days during the second quarter of 2019.
For the second quarter of 2020, we incurred a net loss on forward freight agreements and bunker swaps of $8.1 million, consisting of $16.0 million of realized gain and $24.1 million of unrealized loss. For the second quarter of 2019 we incurred a net loss on forward freight agreements and bunker swaps of $1.0 million, consisting of realized gain of $3.1 million and unrealized loss of $4.1 million.
Interest and finance costs net of interest and other income/(loss) for the second quarters of 2020 and 2019 were $17.8 million and $21.0 million, respectively. Despite the increase in the weighted average balance of our outstanding indebtedness of $1,601.4 million during the second quarter of 2020, compared to $1,474.6 million for the same period in 2019, the interest and finance costs net of interest and other income/ (loss) decreased due to the decrease in the average interest rate on our outstanding indebtedness, mainly driven by the refinancing of certain of our debt agreements, the swap agreements that we entered during the second quarter of 2020 and the lower LIBOR rates during the second quarter of 2020.
First half 2020 and 2019 Results
Voyage revenues for the first half of 2020 decreased to $307.0 million from $324.3 million in the first half of 2019. Adjusted TCE Revenues were $196.7 million for the first half of 2020, compared to $195.7 million for the first half of 2019. Adjusted TCE Revenues were positively impacted by an increase in realized gain on forward freight agreements and bunker swaps of $19.6 million in the first half of 2020 compared to a realized gain of $8.4 million in the first half of 2019, partially counterbalancing the negative impact of COVID-19 in the dry bulk market. As a result, the TCE rate for the first half of 2020 was $10,128 compared to $10,880 for the first half of 2019.
For the first half of 2020, operating loss was $2.8 million, which includes depreciation of $70.0 million while for the first half of 2019, operating loss was $1.2 million, which includes depreciation of $59.8 million. Depreciation increased during the first half of 2020 due to the increase in the average number of vessels in our fleet to 116.0 from 107.2..
For the first half of 2020 we had a net loss of $41.4 million, or $0.43 loss per share, basic and diluted, based on 95,797,142 weighted average basic and diluted shares, while for the first half of 2019 we had a net loss of $45.5 million, or $0.49 loss per share, basic and diluted, based on 92,457,415 weighted average basic and diluted shares.
Net loss for the first half of 2020, included the following significant non-cash items, in addition to depreciation expense mentioned above:
Stock-based compensation expense of $1.2 million, or $0.01 per share, basic and diluted, recognized in connection with common shares granted to our directors and employees, which includes a reversal of previously recognized cost of $1.2 million following the reassessment of the probability of achieving the performance conditions for some of our awards;
Amortization of the fair value of below-market acquired time charters of $0.7 million, or $0.01 per share, basic and diluted, associated with time charters attached to vessels acquired. The respective amortization was recorded as an increase to voyage revenues; and
Loss on debt extinguishment of $0.5 million or $0.01 per share, basic and diluted, recognized in connection with the refinancing of one of our debt facilities.
Net loss for the first half of 2019, included the following significant non-cash items, in addition to depreciation expense mentioned above:
Unrealized loss on forward freight agreements and bunker swaps of $1.0 million or $0.01 per share, basic and diluted;Stock-based compensation expense of $2.9 million, or $0.03 per share, basic and diluted, recognized in connection with common shares granted to our directors and employees;Impairment loss of $3.4 million, or $0.04 per share, basic and diluted, recognized in connection with the agreement to sell the vessels Star Anna and Star Gamma;Loss on bad debt of $1.3 million or $0.01 per basic and diluted share associated with the write‐off of disputed charterer balances; andNet amortization of the fair value of below and above market acquired time charters of $1.2 million, or $0.01 per share, basic and diluted, associated with time charters attached to vessels acquired. The respective net amortization was recorded as an increase to voyage revenues.Adjusted net loss for the first half of 2020, which excludes certain non-cash items, was $40.3 million, or $0.42 loss per share, basic and diluted compared to an adjusted net loss for the first half of 2019 of $26.9 million, or $0.29 loss per share, basic and diluted.
Adjusted EBITDA for the first half of 2020, which excludes certain non-cash items was $67.7 million compared to $77.2 million adjusted EBITDA for the first half of 2019.
For the first half of 2020 and 2019, vessel operating expenses were $85.2 million and $78.1 million, respectively. This increase was attributable to the increase in the average number of vessels to 116.0 from 107.2. Our average daily operating expenses per vessel for the first half of 2020 and 2019, were $4,037 and $4,025, respectively.
During the first half of 2020, we incurred $20.9 million dry docking expenses mainly attributable to 25 of our vessels that completed their periodic dry docking surveys within such period. During the first half of 2019, we incurred dry docking expenses of $28.7 million mainly attributable to 12 of our vessels that completed their periodic dry docking surveys during such period, resulting in expenses of $12.3 million while the remaining $16.4 million were incurred in connection with in-progress and upcoming dry dockings.
General and administrative expenses for the first half of 2020 were $15.0 million compared to $17.1 million during the first half of 2019. The decrease is primarily attributable to the decrease in stock-based compensation expense to $1.2 million in the first half of 2020 from $2.9 million in the first half of 2019 affected also by a reversal of previously recognized cost of $1.2 million following the reassessment of the probability of achieving the performance conditions for some of our awards. Management fees for the first half of 2020 and 2019 were $9.2 million and $8.2 million, respectively. The increase is attributable to the new management agreements entered into in connection with the fleet we acquired during the third quarter of 2019. Our average daily net cash general and administrative expenses per vessel (including management fees) for the first half of 2020 were increased to $1,052 from $990 during the first half of 2019. This increase in daily figures is attributable to the significant decrease in ownership and charter-in days in aggregate during the corresponding periods discussed also below (please see the table at the end of this release for the calculation of the Average daily Net Cash G&A expenses per vessel).
Charter-in hire expense for the first half of 2020 and 2019 was $14.1 million and $44.4 million, respectively. This decrease is attributable to the significant decrease in charter-in days from 3,208 in the first half of 2019 to 726 during the first half of 2020.
For the first half of 2020, we incurred a gain on forward freight agreements and bunker swaps of $19.5 million, consisting of a realized gain of $19.6 million and an unrealized loss of $0.1 million. For the first half of 2019, we incurred a gain on forward freight agreements and bunker swaps of $7.4 million, consisting of a realized gain of $8.4 million and an unrealized loss of $1.0 million.
Interest and finance costs net of interest and other income/ (loss) for the first half of 2020 and 2019 were $37.9 million and $42.7 million, respectively. Despite the increase in the weighted average balance of our outstanding indebtedness to $1,597.3 million during the first half of 2020 from $1,468.4 million during the first half of 2019, the interest and finance costs net of interest and other income/ (loss) decreased due to the decrease in the average interest rate on our outstanding indebtedness, mainly driven by the refinancing of certain of our debt agreements, the swap agreements that we entered during the second quarter of 2020 and the lower LIBOR rates during the first half of 2020.
Liquidity and Capital Resources
Cash Flows
Net cash provided by operating activities for the first half of 2020 and 2019 was $55.5 million and $7.6 million, respectively.
Despite the decrease in Adjusted EBITDA to $67.7 million during the first half of 2020 from $77.2 million during the corresponding period in 2019, our cash provided by operating activities increased in 2020 compared to 2019 due to (i) a net working capital inflow of $22.1 million compared to a net working capital outflow of $19.1 million during the first half of 2019 and (ii) lower net interest expense for the first half of 2020 compared to the corresponding period in 2019.
Net cash used in investing activities for the first half of 2020 and 2019 was $48.2 million and $132.1 million.
For the first half of 2020, net cash used in investing activities consisted of $51.3 million paid in connection with the acquisition and installation of scrubber equipment and ballast water management systems for certain of our vessels, offset partially by insurance proceeds of $3.1 million.
For the first half of 2019, net cash used in investing activities mainly consisted of (i) $93.2 million paid in connection with our newbuilding and newly acquired vessels and other capitalized expenses and (ii) $64.6 million paid for the acquisition and installation of scrubber equipment and ballast water management systems for certain of our vessels, offset partially by proceeds from the sale of three vessels concluded during the period of $20.0 million and insurance proceeds of $5.7 million.
During the first half of 2020 net cash used in financing activities was $25.9 million while during the first half of 2019 net cash provided by financing activities was $7.0 million.
For the first half of 2020, net cash used in financing activities mainly consisted of:
$149.1 million of proceeds from loan and lease financings including $53.8 million drawn under the HSBC Working Capital Facility;
offset by:
$93.4 million lease and debt repayments in connection with the regular amortization of outstanding vessel financings, $24.2 million repayment under the HSBC Working Capital Facility and $51.6 million early repayment due to the refinancing of certain of our finance agreements;
$0.9 million of financing fees paid in connection with the new financing agreements; and
$4.8 million of dividends paid in March 2020 for the fourth quarter of 2019.
For the first half of 2019, net cash provided by financing activities mainly consisted of:
$392.4 million of proceeds from financing including financing from leases;
offset by:
$366.1 million lease and debt obligations paid in aggregate in connection with: (i) the regular amortization of outstanding vessel financings and finance lease installments, and (ii) early repayment due to the refinancing of certain of our finance agreements and the sale of three of our vessels;
$11.6 million used to repurchase our common shares in open market transactions;
$6.2 million of financing fees paid in connection with the new financing agreements; and
$1.5 million of prepayment fees paid in connection with early repaid debt.
Navios Maritime Holdings Inc. Takes Hit from Weak Dry Bulk Market
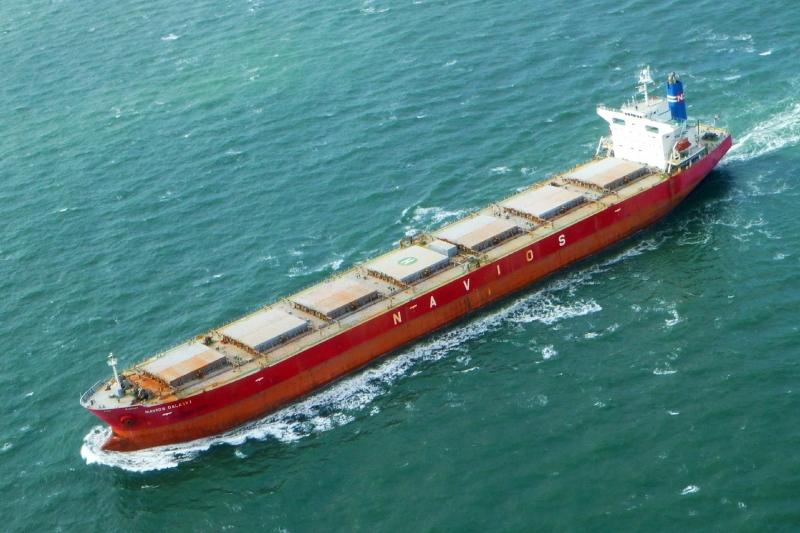
Navios Maritime Holdings Inc., a global seaborne shipping and logistics company, today reported financial results for the first quarter ended March 31, 2020.
Angeliki Frangou, Chairman and Chief Executive Officer, stated, “While the humanitarian crises caused by the pandemic has been heart breaking, we have also been strengthened by the courage and compassion of the first responders, particularly the many dedicated health care workers. I am proud of the members of the Navios family as they have shown admirable resilience during this unprecedented time of uncertainty, and we have taken the necessary measures to ensure safety of our people while keeping our fleet functioning.”
Angeliki Frangou continued, “For the first quarter of 2020, Navios Holdings reported revenue of $91.1 million, Adjusted EBITDA of $28.7 million and a TCE equivalent of $7,082. We experienced weak charter rates in the drybulk market in the first quarter and so far in the second quarter. Year to date 2020, the capesize 5TC rate averaged around $5,000 per day versus the 2019 average of $18,000 per day. We anticipate growth in the second half of the year as global economic activity returns.”
HIGHLIGHTS – RECENT DEVELOPMENTS
Fleet update
In May 2020, the Company sold to an unrelated third party the Navios Star, a 2002-built Panamax vessel of 76,662 dwt, for a sale price of $6.7 million.
In May 2020, the Company took delivery of the Navios Magellan II, a newbuilt Panamax vessel of 82,037 dwt under bareboat charter.
In March 2020, the Company took delivery of the Navios Galaxy II, a newbuilt Panamax vessel of 81,789 dwt under bareboat charter.
In March 2020, the Company acquired from an unrelated third party, a previously chartered-in vessel, the Navios Corali, a 2015-built Capesize vessel of 181,249 dwt, for an acquisition price of $36.6 million, which was paid in cash. The acquisition was financed through a sale and leaseback transaction with an unrelated third party.
Liquidation of Navios Europe (II) Inc. (“Navios Europe II”)
Navios Europe II, an entity in which Navios Holdings holds a 47.5% economic interest, is the owner of seven container vessels and seven dry bulk vessels. As of March 31, 2020, Navios Holdings had a receivable of approximately $31.5 million from Navios Europe II. Following the decision of the shareholders of Navios Europe II in May 2020 to liquidate the structure, a Special Committee of the Board of Directors comprised of independent directors, approved the allocation of assets. As part of the transaction, it is anticipated that Navios Holdings will receive cash subject to working capital adjustments at closing and will acquire two unencumbered Panamax dry bulk vessels. Closing is expected to occur during the second quarter of 2020. No assurances can be provided that definitive agreements will be executed or that the transaction will be completed in whole or in part.
Debt update
In June 2020, the Company entered into a secured loan agreement with Navios Shipmanagement Holdings Corporation, a wholly owned subsidiary of N Shipmanagement Acquisition Corp. (collectively “NSM”) for a loan of up to $50.0 million to be used for general corporate purposes. The terms and conditions of the secured loan agreement were approved by a Special Committee of the Board of Directors comprised of independent directors. The loan agreement will be repayable in 18 equal consecutive quarterly installments from the initial drawdown. Principal payments that fall due during the first year following the initial drawdown may be deferred, at the Company’s election, in whole or in part. The loan agreement provides for interest at a rate of 5% annually (and 7% annually for deferred principal amounts). No amount has been drawn to date.
Fleet statistics
Navios Holdings controls a fleet of 52 vessels totaling 5.6 million dwt, of which 34 are owned (including five bareboat-in vessels) and 18 are chartered-in under long-term charters (collectively, the “Core Fleet”). The fleet consists of 17 Capesize, 27 Panamax, six Ultra-Handymax and two Handysize vessels, with an average age of 7.6 years.
Navios Holdings has currently chartered-out 83.9% for the remaining nine months of 2020. Of these available days, 32.9% are chartered-out on fixed rate and 51.0% are chartered-out on index. The average contracted daily charter-in rate for the long-term charter-in vessels is $12,971 per day.
The above figures do not include the fleets of Navios South American Logistics Inc. (“Navios Logistics”) and vessels servicing contracts of affreightment.
Exhibit II provides certain details of the Core Fleet of Navios Holdings. It does not include the fleet of Navios Logistics.
Non-GAAP Measures
EBITDA, Adjusted EBITDA, Adjusted Net (Loss)/Income attributable to Navios Holdings’ common stockholders and Adjusted Basic Loss attributable to Navios Holdings’ common stockholders per share are non-U.S. GAAP financial measures and should not be used in isolation or as substitution for Navios Holdings’ results calculated in accordance with U.S. GAAP.
See Exhibit I under the heading, “Disclosure of Non-GAAP Financial Measures,” for a discussion of EBITDA, Adjusted EBITDA, Adjusted Net (Loss)/Income attributable to Navios Holdings’ common stockholders and Adjusted Basic Loss attributable to Navios Holdings’ common stockholders per share of Navios Holdings (including Navios Logistics), and EBITDA of Navios Logistics (on a stand-alone basis) and a reconciliation of such measures to the most comparable measures calculated under U.S. GAAP.
As of November 30, 2018, Navios Holdings obtained control over Navios Maritime Containers L.P. (“Navios Containers”) and consequently consolidated Navios Containers from that date onwards. Following the sale of Navios Containers general partnership interest on August 30, 2019, Navios Holdings deconsolidated Navios Containers from that date onwards. The results of operations of Navios Containers for the period from January 1, 2019 to March 31, 2019 consolidated under Navios Holdings have been reported as discontinued operations.
View Full Report
Globus Maritime Limited Expects Volatile, but Rising Dry Bulk Market Moving Forward
Globus Maritime Limited, a dry bulk shipping company, yesterday reported its unaudited consolidated operating and financial results for the quarter and nine-month period ended September 30, 2019.
Management Commentary
“During the third quarter we experienced a short-term spike in the spot market that allowed us to enjoy higher than normal rates. However, the spike was short-lived and fluctuation returned full-speed, spilling over into the fourth quarter. This was mainly due to the an increase in vessel supply returning online from dry docks and was further deteriorated by some demand-driven pressure which put a weight on rates. By the end of the quarter and the beginning of the fourth quarter there was a strong downward pressure which thankfully started to reverse later on.
“The doubling and tripling of day rates showed us however, that there is steam in the market, and these upward swings can be expected. Of course we are still being affected by the negative sentiment created by the trade war, as well as the ore export bans in Indonesia and the coal import quotas in China.
“Coming up into the fourth quarter we have scheduled maintenance repairs for two of our vessels. We do not expect any extraordinary items during the repairs, normal maintenance of hull, cargo holds and machineries will take place. We expect the repairs to last for about 40 days. Notwithstanding our constant vigilance on cost our first priority is to keep our vessels safe.
“The market is expected to be volatile, but we do expect an upward trend. The huge industry adjustment to IMO 2020 regulation is just around the corner, and we will see the full effect of this event during the first half of the year. We believe it will be a net positive for the industry. The margin at the moment of the low sulfur fuel oils and high sulfur fuel oils is at about $250. Our company will be using the low sulfur fuel oil option in order to comply with the new regulations. We believe that this is a better-suited approach for the type and size of our vessels than using exhaust gas scrubbers that are expensive to install and operate.”
Management Discussion and Analysis of the Results of Operations
Recent Developments
New Convertible Note
On March 13, 2019, the Company signed a securities purchase agreement with a private investor and on March 13, 2019 issued, for gross proceeds of $5 million, a senior convertible note (the “Convertible Note”) that is convertible into shares of the Company’s common stock, par value $0.004 per share. If not converted or redeemed beforehand pursuant to the terms of the Convertible Note, the Convertible Note matures upon the anniversary of its issue. We have used part of the proceeds from the Convertible Note for general corporate purposes and working capital including repayment of debt. The Convertible Note was issued in a transaction exempt from registration under the Securities Act.
Further to the conversion clause included into the Convertible Note, during the third quarter of 2019, a total amount of approximately $488 thousand, principal and accrued interest, was converted to share capital with the conversion price of $2.25 per share and a total number of 216,863 new shares issued in the name of the holder of the Convertible Note. Furthermore, during October and November 2019, an additional total amount of approximately $1,170 thousand, principal and accrued interest, was converted to share capital with the conversion price of $2.25 per share and a total number of 519,874 new shares issued in the name of the holder of the Convertible Note. The Convertible Note provides that the “Floor Price” (as defined in the Note), which is currently $2.25, may be reduced to not less than $1.00 by mutual agreement of the Company and the holder of the Note.
The Convertible Note provides for interest to accrue at 10% annually, which interest shall be paid on the first anniversary of the Convertible Note’s issuance unless the Convertible Note is converted or redeemed pursuant to its terms beforehand. The interest may be paid in common shares of the Company, if certain conditions described within the Convertible Note are met.
As per the conversion clause included in the Note, the Company has recognized it as a hybrid agreement which includes an embedded derivative. This embedded derivative was separated to the derivative component and the non-derivative host. The derivative component is shown separately from the non-derivative host at fair value. The changes in the fair value of the derivative financial instrument are recognized in the consolidated statement of comprehensive loss. For the period ended September 30, 2019, the Company recognized a gain on this derivative financial instrument amounting to $2.7 million, which was classified under “Gain on derivative financial instruments” in the consolidated statement of comprehensive income/(loss).
Upon any future stock dividend, stock split, reverse stock split or similar transaction, the Floor Price will not be adjusted, and the Floor Price following such transaction will be equal to the Floor Price immediately prior to such transaction.
The terms of the Note provide that the Note may be required at the option of the holder to be redeemed by the Company in cash, in whole or in part, at any time following any consecutive period of ten trading days during each of which the volume-weighted average price of the Company’s common shares is less than the Floor Price.
Conversion of Debt and Issuance of Shares
On May 2, 2019, Globus announced that, in accordance with the terms and provisions of the revolving credit facility, dated November 21, 2018, between the Company and Firment Shipping Inc., an entity deemed as an affiliated party through common control, the Company has elected to convert the aggregate outstanding principal balance and accrued interest of $3,170,136 into 1,132,191 shares of common stock of the Company.
Loan Refinancing
In June 2019, Globus through its wholly-owned subsidiaries, Devocean Maritime Ltd., Domina Maritime Ltd., Dulac Maritime S.A., Artful Shipholding S.A. and Longevity Maritime Limited, vessel-owning companies of m/v River Globe, m/v Sky Globe, m/v Star Globe, m/v Moon Globe and m/v Sun Globe, respectively, entered a new-term loan facility for up to $37 million with EnTrust Global’s Blue Ocean Fund (“Entrust loan facility”) for the purpose of refinancing the existing indebtedness secured on the ships and for general corporate purposes. Globus subsidiaries, namely Devocean Maritime Ltd., Domina Maritime Ltd., Dulac Maritime S.A., Artful Shipholding S.A. and Longevity Maritime Limited, are identified as the borrowers under the loan facility which is guaranteed by Globus, and which contains a standard security package including mortgages on all of our ships, pledges of bank accounts, charter assignments, shares pledges respecting each borrower, and a general assignment over each ship’s earnings, insurances and any requisition compensation in relation to that ship. This loan facility will be referred to as EnTrust loan facility. On June 24, 2019, the Company drew down $37 million and fully prepaid the existing loan facilities with Hamburg Commercial Bank AG (formerly known as HSH Nordbank AG) and Macquarie Bank International Limited.
The EnTrust loan facility bears interest at LIBOR plus a margin of 8.5% (or 10.5% default interest), and is repayable by five consecutive quarterly installments commencing on December 31, 2019 each in the amount of the earnings of the ships after deducing interest on the EnTrust loan facility, operating expenses and reserves for dry-docking, then by six consecutive quarterly installments commencing on March 31, 2021 each in the amount of $1,492,622, and by a final installment on June 30, 2022 in the amount of $1,492,622 together with the remaining principal amount as a balloon payment.
The Company must maintain a credit balance of not less than $250,000 for each mortgaged ship. Globus must maintain, on a consolidated basis, at the end of each calendar quarter, liquid funds in an amount, in aggregate, of not less than 5% of the consolidated financial indebtedness of the group. Each borrower must maintain in its earnings account during the cash sweep period an amount equal to the product of (a) the lower of: (i) $1,000; and (ii) the difference between the daily time charter equivalent rate of the ship owned by that borrower, and the break-even expenses of that ship for that cash sweep period; and (b) the actual number of days lapsed during that cash sweep period for that borrower. Each borrower is prohibited from declaring or paying dividends, or from repaying the EnTrust loan facility, until December 25, 2020. The EnTrust loan facility contains standard loan covenants, including loan to value covenants.
Results of Operations
Third quarter of the year 2019 compared to the third quarter of the year 2018
Total comprehensive income for the third quarter of the year 2019 amounted to $280 thousand or $0.06 basic and diluted earnings per share based on 4,422,825 weighted average number of shares, compared to total comprehensive income of $254 thousand for the same period last year or $0.08 basic and diluted earnings per share based on 3,204,271 weighted average number of shares.
Full Report