
Dorian LPG Ltd. Declares Irregular Cash Dividend of $1.00 Per Share
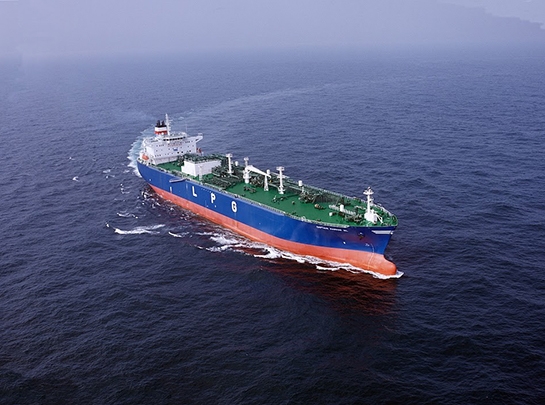
Dorian LPG Ltd. (NYSE: LPG) (the “Company” or “Dorian LPG”), a leading owner and operator of modern and ECO very large gas carriers (“VLGCs”), announced that its Board of Directors has declared an irregular cash dividend of $1.00 per share of the Company’s common stock, returning approximately $42.8 million of capital to shareholders.
The irregular dividend is payable on or about May 28, 2026 to all shareholders of record as of the close of business on May 18, 2026.
Dorian LPG: Έκτακτο μέρισμα 1 δολαρίου ανά μετοχή
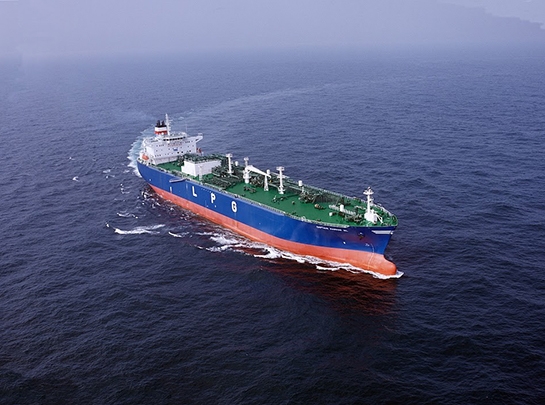
Τη διανομή έκτακτου μερίσματος σε μετρητά ύψους 1 δολαρίου ανά κοινή μετοχή ενέκρινε το διοικητικό της Dorian LPG Ltd., συμφερόντων Γιάννη Χατζηπατέρα, επιστρέφοντας στους μετόχους της συνολικά περίπου 42,8 εκατ. δολάρια.
Η πληρωμή του μερίσματος θα πραγματοποιηθεί περίπου στις 28 Μαΐου 2026, προς τους μετόχους που θα είναι εγγεγραμμένοι στα αρχεία της εταιρείας κατά το κλείσιμο της αγοράς στις 18 Μαΐου 2026.
Η κίνηση αυτή επιβεβαιώνει τη δέσμευση της εταιρείας για ανταμοιβή των μετόχων της, σε μια περίοδο όπου η αγορά μεταφοράς LPG παραμένει κρίσιμη για τις θαλάσσιες μεταφορές ενέργειας.
Η Dorian LPG συγκαταλέγεται στους κορυφαίους ιδιοκτήτες και διαχειριστές σύγχρονων VLGCs, διαθέτοντας στόλο 27 πλοίων, εκ των οποίων έξι είναι dual-fuel ECO VLGCs, 19 ECO VLGCs και δύο ακόμη σύγχρονα VLGCs.
Dorian LPG: Παρέλαβε το διπλού καυσίμου νεότευκτο «Areion»
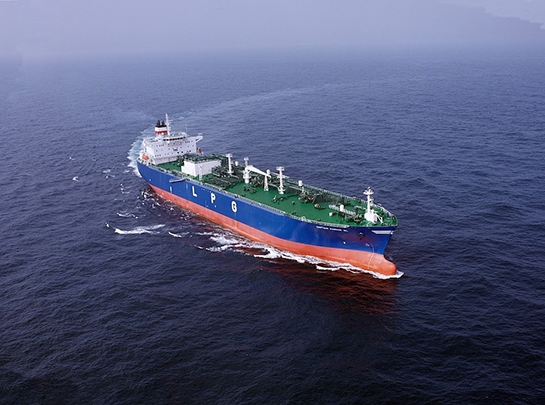
Στην ενίσχυση του στόλου της με ένα σύγχρονο και περιβαλλοντικά αποδοτικό πλοίο προχώρησε η Dorian LPG Ltd, με την παραλαβή του νεότευκτου VLGC/AC «Areion».
Το πλοίο, που είναι χωρητικότητας 93.000 κυβικών μέτρων, ναυπηγήθηκε στις εγκαταστάσεις της Hanwha Ocean, στο Okpo Shipyard της Νοτίου Κορέας, επιβεβαιώνοντας τη στροφή της εταιρείας προς τεχνολογίες που μειώνουν το περιβαλλοντικό αποτύπωμα της ναυτιλίας.
Το «Areion» είναι πλοίο διπλού καυσίμου (dual-fuel), με δυνατότητα χρήσης υγραερίου (LPG) για την πρόωσή του, ενώ είναι εξοπλισμένο με υβριδικό σύστημα καθαρισμού καυσαερίων (scrubber). Το σύστημα αυτό λειτουργεί σε κλειστό κύκλωμα σε λιμάνια και περιοχές ελέγχου εκπομπών (ECA), συμβάλλοντας στη σημαντική μείωση εκπομπών θείου (SOx), σωματιδίων και αιθάλης σε σύγκριση με τα συμβατικά καύσιμα τύπου VLSFO.
Ιδιαίτερη σημασία αποδίδεται και στον κύριο κινητήρα του πλοίου, ο οποίος, όταν λειτουργεί με LPG, επιτυγχάνει μείωση των εκπομπών διοξειδίου του άνθρακα (CO₂) κατά περίπου 20%, ενισχύοντας την προσπάθεια για πιο βιώσιμες θαλάσσιες μεταφορές.
Αυτό είναι το δεύτερο πλοίο διπλού καυσίμου LPG που προστίθεται στον στόλο της Dorian και μαζί με τα τέσσερα ναυλωμένα πλοία διπλού καυσίμου LPG, αυξάνεται το ποσοστό των πλοίων εναλλακτικών καυσίμων χαμηλών εκπομπών σε πάνω από 20% του στόλου της.
Το «Areion» θα ξεκινήσει τη ναύλωση στο πλαίσιο της Helios LPG Pool, μιας κοινοπραξίας που ελέγχεται από κοινού από την Dorian LPG Ltd και τη MOL Energia Pte Ltd., με γραφεία στην Κοπεγχάγη και τη Σιγκαπούρη.
Σχολιάζοντας την παραλαβή και την ένταξη του πλοίου στην εταιρεία, ο πρόεδρος και διευθύνων σύμβουλός της, Τζον Χατζηπατέρας, υπογράμμισε τη στρατηγική προσήλωση της Dorian LPG στην υιοθέτηση προηγμένων τεχνολογιών, που ενισχύουν τόσο την ανταγωνιστικότητα όσο και τη βιωσιμότητα του στόλου της.
Dorian LPG Ltd. Reports Strong Results on Favorable Market Conditions
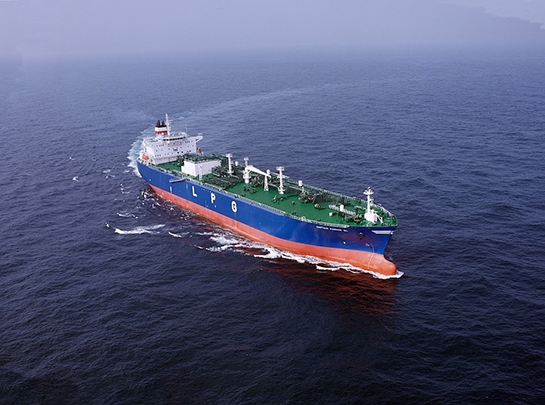
Dorian LPG Ltd., a leading owner and operator of modern very large gas carriers (“VLGCs”), reported its financial results for the three months ended December 31, 2023.
Key Recent Development
Declared an irregular cash dividend totaling $40.6 million to be paid on or about February 27, 2024.
Highlights for the Third Quarter Fiscal Year 2024
Revenues of $163.1 million.
Time Charter Equivalent (“TCE”)(1) rate per operating day for our fleet of $76,337.
Net income of $100.0 million, or $2.47 earnings per diluted share (“EPS”), and adjusted net income(1) of $106.0 million, or $2.62 adjusted earnings per diluted share (“adjusted EPS”).(1)
Adjusted EBITDA(1) of $133.0 million.
Declared and paid an irregular cash dividend totaling $40.6 million in November 2023.
Entered into the 2023 A&R Debt Facility (amending and restating the 2022 Debt Facility) to upsize the revolving credit facility amount to $50.0 million and added a new, uncommitted accordion term loan facility, in an aggregate principal amount of up to $100.0 million.
Entered into an agreement for a newbuilding Very Large Gas Carrier / Ammonia Carrier expected to be delivered in the third calendar quarter of 2026 for which we made the first $23.8 million installment payment in January 2024.
John C. Hadjipateras, Chairman, President and Chief Executive Officer of the Company, commented, “We are reporting strong financial results, reflecting an extremely favorable market and great teamwork. The dividend declared last week was our tenth, bringing our cumulative dividend payments to over $463 million. We placed an order to build a new VLGC/AC as we believe in the long-term fundamentals in the LPG market and the potential for ammonia transportation. With the geopolitical environment remaining very challenging, as highlighted by recent hostilities in the Red Sea, we are particularly mindful of the safety of our seafarers.”
Third Quarter Fiscal Year 2024 Results Summary
Net income amounted to $100.0 million, or $2.47 per diluted share, for the three months ended December 31, 2023, compared to $51.3 million, or $1.27 per diluted share, for the three months ended December 31, 2022.
Adjusted net income amounted to $106.0 million, or $2.62 per diluted share, for the three months ended December 31, 2023, compared to adjusted net income of $52.0 million, or $1.29 per diluted share, for the three months ended December 31, 2022. Adjusted net income for the three months ended December 31, 2023 is calculated by adjusting net income for the same period to exclude an unrealized loss on derivative instruments of $6.1 million. Please refer to the reconciliation of net income to adjusted net income, which appears later in this press release.
The $54.0 million increase in adjusted net income for the three months ended December 31, 2023, compared to the three months ended December 31, 2022, is primarily attributable to increases of $59.8 million in revenues, $1.7 million in interest income, and $0.5 in realized gain on derivatives; partially offset by increases of $3.2 million in charter hire expenses, $1.5 in interest and finance costs, $1.4 million in depreciation and amortization, $1.3 million in vessel operating expenses, $0.8 million in general and administrative expenses, and $0.4 million in voyage expenses.
The TCE rate per operating day for our fleet was $76,337 for the three months ended December 31, 2023, a 44.7% increase from $52,768 for the same period in the prior year, driven by higher spot rates and moderately lower bunker prices. Please see footnote 7 to the table in “Financial Information” below for information related to how we calculate TCE. Total fleet utilization (including the utilization of our vessels deployed in the Helios Pool) decreased from 97.8% during the three months ended December 31, 2022 to 93.6% during the three months ended December 31, 2023.
Vessel operating expenses per day increased to $9,936 for the three months ended December 31, 2023 compared to $9,739 in the same period in the prior year. Please see “Vessel Operating Expenses” below for more information.
Revenues
Revenues, which represent net pool revenues—related party, time charters and other revenues, net, were $163.1 million for the three months ended December 31, 2023, an increase of $59.8 million, or 57.8%, from $103.3 million for the three months ended December 31, 2022 primarily due to an increase in average TCE rates and fleet size, partially offset by a reduction of fleet utilization. Average TCE rates increased by $23,569 per operating day from $52,768 for the three months ended December 31, 2022 to $76,337 for the three months ended December 31, 2023, primarily due to higher spot rates and moderately lower bunker prices. The Baltic Exchange Liquid Petroleum Gas Index, an index published daily by the Baltic Exchange for the spot market rate for the benchmark Ras Tanura-Chiba route (expressed as U.S. dollars per metric ton), averaged $132.773 during the three months ended December 31, 2023 compared to an average of $119.106 for the three months ended December 31, 2022. The average price of very low sulfur fuel oil (expressed as U.S. dollars per metric ton) from Singapore and Fujairah decreased slightly from $676 during the three months ended December 31, 2022, to $653 during the three months ended December 31, 2023. Our available days increased from 1,993 for the three months ended December 31, 2022 to 2,272 for the three months ended December 31, 2023 due to three additional vessels in our fleet. Our fleet utilization decreased from 97.8% during the three months ended December 31, 2022 to 93.6% during the three months ended December 31, 2023.
Charter Hire Expenses
Charter hire expenses for the vessels chartered in from third parties were $8.4 million and $5.2 million for the three months ended December 31, 2023 and 2022, respectively. The increase of $3.2 million, or 60.3%, was mainly caused by an increase in the number of chartered-in days from 184 for the three months ended December 31, 2022 to 368 for the three months ended December 31, 2023, offset by certain credits claimed under the terms of the time charters.
Vessel Operating Expenses
Vessel operating expenses were $19.2 million during the three months ended December 31, 2023, or $9,936 per vessel per calendar day, which is calculated by dividing vessel operating expenses by calendar days for the relevant time-period for the technically-managed vessels that were in our fleet. The increase of $1.3 million, or 7.1% from $17.9 million for the three months ended December 31, 2022 was partially due to an increase in operating expenses per vessel per calendar day along with an increase of calendar days for our fleet from 1,840 during the three months ended December 31, 2022 to 1,932 during the three months ended December 31, 2023 days resulting from the delivery of our dual-fuel VLGC Captain Markos in March 2023. The increase of $197 per vessel per calendar day, from $9,739 for the three months ended December 31, 2022 to $9,936 per vessel per calendar day for the three months ended December 31, 2023 was primarily the result of increases of $444 per vessel per calendar day for spares and stores and $120 per vessel per calendar day for repairs and maintenance, partially offset by decreases of $172 per vessel per calendar day for crew wages and related costs and $176 per vessel per calendar day for miscellaneous expenses.
General and Administrative Expenses
General and administrative expenses were $7.7 million for the three months ended December 31, 2023, an increase of $0.8 million, or 10.2%, from $6.9 million for the three months ended December 31, 2022 and was driven by increases of $0.3 million in stock-based compensation, $0.2 million in cash bonuses, and $0.3 million in other general and administrative expenses.
Interest and Finance Costs
Interest and finance costs amounted to $10.1 million for the three months ended December 31, 2023, an increase of $1.5 million, or 16.7%, from $8.6 million for the three months ended December 31, 2022. The increase of $1.5 million during this period was mainly due to increases of $1.0 million in loan interest and a reduction of $0.4 million in capitalized interest. The increase in interest on our long-term debt was driven by an increase in average interest rates due to rising SOFR on our floating-rate long-term debt, partially offset by a decrease in average indebtedness, excluding deferred financing fees, from $645.0 million for the three months ended December 31, 2022 to $633.2 million for the three months ended December 31, 2023. As of December 31, 2023, the outstanding balance of our long-term debt, net of deferred financing fees of $5.6 million, was $618.1 million.
Unrealized Loss on Derivatives
Unrealized loss on derivatives amounted to $6.1 million for the three months ended December 31, 2023, compared to a loss of $0.7 million for the three months ended December 31, 2022. The $5.4 million increase is primarily attributable to changes in forward SOFR yield curves.
Realized Gain on Derivatives
Realized gain on derivatives amounted to $1.9 million for the three months ended December 31, 2023, compared to a realized gain of $1.4 million for the three months ended December 31, 2022. The favorable $0.5 million difference is due to an increase in floating SOFR resulting in the realized gain on our interest rate swaps.
View Full Press Release
Dorian LPG Ltd. Rides Positive Chartering Environment

Dorian LPG Ltd., a leading owner and operator of modern very large gas carriers (“VLGCs”), reported its financial results for the three months ended June 30, 2022, and announced that its Board of Directors has declared an irregular cash dividend of $1.00 per share of the Company’s common stock, returning over $40.1 million of capital to shareholders. The dividend is payable on or about September 2, 2022 to all shareholders of record as of the close of business on August 15, 2022.
Key Recent DevelopmentsDeclared an irregular cash dividend totaling over $40 million.Entered into a $260.0 million debt financing facility (the “2022 Debt Facility”) to refinance indebtedness under the 2015 AR Facility and the Concorde Japanese Financing (upon its repurchase in September 2022) and to releverage Corvette following its repurchase on July 21, 2022.
Highlights for the First Quarter Fiscal Year 2023• Revenues of $76.8 million.• Time Charter Equivalent (“TCE”)(1) rate per operating day for our fleet of $39,608.• Net income of $24.8 million, or $0.62 earnings per diluted share (“EPS”), and adjusted net income(1) of $22.4 million, or $0.56 adjusted earnings per diluted share (“adjusted EPS”).(1)• Adjusted EBITDA(1) of $46.9 million.• Declared an irregular cash dividend totaling $100.3 million.• Completed the refinancing of Cougar resulting in cash proceeds, net of $20.0 million to prepay a portion of the 2015 AR Facility, of $29.9 million.• Voluntarily prepaid $25.0 million of the 2015 AR Facility.• Provided three-month notice in connection with the exercise of our repurchase option of Concorde for $41.2 million in cash and application of the of $14.0 million deposit.
John C. Hadjipateras, Chairman, President and Chief Executive Officer of the Company, commented, “The first quarter results reflected a good chartering market, which generated strong operating cash flow. We believe that our new seven year facility affords us additional flexibility for capital allocation and are pleased that our board of directors authorized another irregular dividend. I am grateful to our sea and shore personnel who make this possible with their commitment to serving our charterers and to conducting our business with a relentless focus on safety and efficiency.”
First Quarter Fiscal Year 2023 Results SummaryNet income amounted to $24.8 million, or $0.62 per diluted share, for the three months ended June 30, 2022, compared to $5.9 million, or $0.14 per diluted share, for the three months ended June 30, 2021.
Adjusted net income amounted to $22.4 million, or $0.56 per diluted share, for the three months ended June 30, 2022, compared to adjusted net income of $5.4 million, or $0.13 per diluted share, for the three months ended June 30, 2021. Adjusted net income for the three months ended June 30, 2022 is calculated by adjusting net income for the same period to exclude an unrealized gain on derivative instruments of $2.5 million. Please refer to the reconciliation of net income to adjusted net income, which appears later in this press release.
The $17.0 million increase in adjusted net income for the three months ended June 30, 2022, compared to the three months ended June 30, 2021, is primarily attributable to an increase of $13.8 million in revenues, decreases of $3.2 million in vessel operating expenses and $1.3 million in depreciation and amortization, a $2.5 million favorable change in other gain/(loss), net, and a $0.8 million favorable change in realized loss on derivatives, partially offset by increases of $2.4 million in interest and finance costs, $1.9 million in charter hire expenses, and $1.4 million in general and administrative expenses.
The TCE rate for our fleet was $39,608 for the three months ended June 30, 2022, a 25.5% increase from a TCE rate of $31,571 for the same period in the prior year, driven by higher spot rates despite increased bunker prices. Please see footnote 7 to the table in “Financial Information” below for information related to how we calculate TCE. Total fleet utilization (including the utilization of our vessels deployed in the Helios Pool) decreased slightly from 96.1% during the three months ended June 30, 2021 to 95.9% during the three months ended June 30, 2022.
Vessel operating expenses per day decreased to $9,378 for the three months ended June 30, 2022 compared to $10,131 in the same period in the prior year. Please see “Vessel Operating Expenses” below for more information.
RevenuesRevenues, which represent net pool revenues—related party, time charters and other revenues, net, were $76.8 million for the three months ended June 30, 2022, an increase of $13.8 million, or 22.0%, from $63.0 million for the three months ended June 30, 2021 primarily due to an increase in average TCE rates, despite a slight decrease in fleet utilization. Average TCE rates increased by $8,037 from $31,571 for the three months ended June 30, 2021 to $39,608 for the three months ended June 30, 2022, primarily due to higher spot rates despite higher bunker prices. The Baltic Exchange Liquid Petroleum Gas Index, an index published daily by the Baltic Exchange for the spot market rate for the benchmark Ras Tanura-Chiba route (expressed as U.S. dollars per metric ton), averaged $76.175 during the three months ended June 30, 2022 compared to an average of $52.790 for the three months ended June 30, 2021. The average price of very low sulfur fuel oil (expressed as U.S. dollars per metric ton), from Singapore and Fujairah increased from $508 during the three months ended June 30, 2021, to $955 during the three months ended June 30, 2022. Our fleet utilization decreased from 96.1% during the three months ended June 30, 2021 to 95.9% during the three months ended June 30, 2022.
Charter Hire ExpensesCharter hire expenses for the vessels chartered in from third parties were $5.4 million and $3.5 million for the three months ended June 30, 2022 and 2021, respectively. The increase of $1.9 million, or 54.0%, was mainly caused by an increase in the number of chartered-in days from 139 for the three months ended June 30, 2021 to 182 for the three months ended June 30, 2022.
Vessel Operating ExpensesVessel operating expenses were $17.1 million during the three months ended June 30, 2022, or $9,378 per vessel per calendar day, which is calculated by dividing vessel operating expenses by calendar days for the relevant time-period for the technically-managed vessels that were in our fleet. The decrease of $3.2 million, or 15.8% from $20.3 million for the three months ended June 30, 2021 was due to a reduction of calendar days for our fleet from 2,002 during the three months ended June 30, 2021 to 1,820 during the three months ended June 30, 2022, driven by the sales of Captain Markos NL and Captain Nicholas ML, prior to the three months ended June 30, 2022. The decrease of $753 per vessel per calendar day, from $10,131 for the three months ended June 30, 2021 to $9,378 per vessel per calendar day for the three months ended June 30, 2022 was partly the result of a $0.9 million, or $426 per vessel per calendar day, decrease in non-capitalizable operating expenses related to the drydocking of vessels. Adjusting for the non-capitalizable drydocking costs, vessel operating expenses per vessel per calendar day decreased $326 during the three months ended June 30, 2022, mainly due to lower crew wages and related costs.
General and Administrative ExpensesGeneral and administrative expenses were $9.4 million for the three months ended June 30, 2022, an increase of $1.4 million, or 17.1%, from $8.0 million for the three months ended June 30, 2021. This increase was driven by an increase of $1.6 million, representing the cash bonuses for the Company’s named executive officers that were approved by the Compensation Committee of the Board of Directors and expensed and paid during the three months ended June 30, 2022, whereas the cash bonuses for the named executive officers of the Company in respect of the fiscal year ended March 31, 2021 were approved by the Compensation Committee of the Board of Directors and expensed and paid during the three months ended September 30, 2021 and not during the three months ended June 30, 2021.
Interest and Finance CostsInterest and finance costs amounted to $8.0 million for the three months ended June 30, 2022, an increase of $2.4 million, or 40.9%, from $5.6 million for the three months ended June 30, 2021. The increase of $2.4 million during this period was mainly due to increases of $2.0 million in interest incurred on our long-term debt and $0.3 million in loan expenses driven by an increase in interest rates and average indebtedness, excluding deferred financing fees, from $600.0 million for the three months ended June 30, 2021 to $687.9 million for the three months ended June 30, 2022. Average interest rates increased on our long-term debt from 3.7% to 4.1% due to rising LIBOR and SOFR on our floating-rate long-term debt. The increase in average indebtedness is due to the refinancings of the VLGCs Constellation, Commander, Cratis, Copernicus, Chaparral and Caravelle during the year ended March 31, 2022, as well as the refinancing of the VLGC Cougar during the three months ended June 30, 2022. As of June 30, 2022, the outstanding balance of our long-term debt, net of deferred financing fees of $6.6 million, was $657.0 million.
Unrealized Gain on DerivativesUnrealized gain on derivatives amounted to $2.5 million for the three months ended June 30, 2022, compared to $0.4 million for the three months ended June 30, 2021. The favorable $2.1 million difference is primarily attributable to an increase in favorable fair value changes to our interest rate swaps resulting from changes in forward LIBOR yield curves.
Realized Loss on DerivativesRealized loss on derivatives amounted to $0.1 million for the three months ended June 30, 2022, compared to $0.9 million for the three months ended June 30, 2021. The favorable $0.8 million difference is due to an increase in floating LIBOR resulting in the reduction of realized losses on our interest rate swaps.
FleetThe following table sets forth certain information regarding our fleet as of July 29, 2022.
Market Outlook & UpdateAfter a slight upturn in average propane and butane prices relative to crude prices in April 2022, propane and butane prices declined during the second calendar quarter of 2022. Propane prices in North-Western Europe fell from an average of 61% of Brent in April 2022 to 46% of Brent in June 2022. In the Far East region, propane prices reached an average of 48% of Brent by the end of the quarter from 66% on average for April 2022.
Additional supply was observed in the market with U.S. exports in the second calendar quarter of 2022 totalling 13.7 million metric tons, 1.7 million metric tons higher than U.S. exports in the previous quarter. Saudi Arabian exports in the second calendar quarter of 2022 were also higher than they were in the first calendar quarter of 2022, averaging approximately 0.6 million metric tons per month during the quarter.
Due to the decrease in propane prices in the East and the continued strength of propane-naphtha’s advantage as a feedstock for the production of ethylene via steam crackers and margins for naphtha crackers (according to consultant, Next-Generation Logistic Ship’s, proprietary model) were predominately negative for the period ended June 2022, with the propane margin averaging approximately $142 per metric ton of ethylene in the second calendar quarter of 2022, a significant improvement from the levels seen in the first calendar quarter of 2022. Despite this, many petrochemical operators were seen to lower operating rates over during the period.
In North-Western Europe, propane continued to provide the largest margin for the production of ethylene via steam crackers until June 2022 when high aromatic prices increased naphtha’s advantage, despite negative propane-naphtha spreads. Since then, margins for naphtha have subsided with propane’s advantage once again returning. Overall, margins for utilising propane as the feedstock in North-Western Europe steam crackers increased from an average of $490 per metric ton in the first calendar quarter of 2022 to over $670 per metric ton on average in the second calendar quarter of 2022. Unlike in the East, margins for European petrochemical players have turned positive for naphtha from the end of the first calendar quarter of 2022 to the beginning of the second calendar quarter of 2022.
For propane dehydrogenation (PDH) operators, margins have remained under pressure during the second calendar quarter of 2022 with some plants lowering operating rates. Furthermore, additional COVID-19 restrictions in China during the second calendar quarter of 2022 has limited the growth in Chinese demand for LPG. Imports into China remained at 6.1 million metric tons in the second calendar quarter of 2022, similar to the levels seen in the fourth calendar quarter of 2021 and the first calendar quarter of 2022.
A key factor of the market going forward will be downstream demand, particularly olefins and polyolefin growth in the East. Overall oil and gas prices will also continue to heavily influence the market particularly with the ongoing conflict between Russia and Ukraine.
The Baltic VLGC index on average increased in the second calendar quarter of 2022 to approximately $76 per metric ton from approximately $57 per metric ton in the second calendar quarter of 2022. Healthy VLGC supply/demand balance and strong bunker prices have contributed to the increased rates observed.
One VLGC was added to the fleet during the second calendar quarter of 2022, with a further 11 vessels expected to be added before the end of 2022.
Currently the VLGC orderbook stands at approximately 20% of the current global fleet. An additional 67 VLGCs equivalent to roughly 6.0 million cbm of carrying capacity are expected to be added to the global fleet by calendar year 2024. The average age of the global fleet is now approximately 10.6 years old.
The above market outlook update is based on information, data and estimates derived from industry sources, and there can be no assurances that such trends will continue or that anticipated developments in freight rates, export volumes, the VLGC orderbook or other market indicators will materialize. This information, data and estimates involve a number of assumptions and limitations, are subject to risks and uncertainties, and are subject to change based on various factors. You are cautioned not to give undue weight to such information, data and estimates. While we believe the market and industry information included in this release to be generally reliable, we have not independently verified any third-party information or verified that more recent information is not available.SeasonalityLiquefied gases are primarily used for industrial and domestic heating, as a chemical and refinery feedstock, as a transportation fuel and in agriculture. The LPG shipping market historically has been stronger in the spring and summer months in anticipation of increased consumption of propane and butane for heating during the winter months. In addition, unpredictable weather patterns in these months tend to disrupt vessel scheduling and the supply of certain commodities. Demand for our vessels therefore may be stronger in the quarters ending June 30 and September 30 and relatively weaker during the quarters ending December 31 and March 31, although 12-month time charter rates tend to smooth these short-term fluctuations and recent LPG shipping market activity has not yielded the expected seasonal results. To the extent any of our time charters expire during the typically weaker fiscal quarters ending December 31 and March 31, it may not be possible to re-charter our vessels at similar rates. As a result, we may have to accept lower rates or experience off-hire time for our vessels, which may adversely impact our business, financial condition, and operating results.
View Full Press Release
Dorian LPG Ltd. Announces First Quarter Fiscal Year 2022 Financial Results, Declares its First Ever Dividend
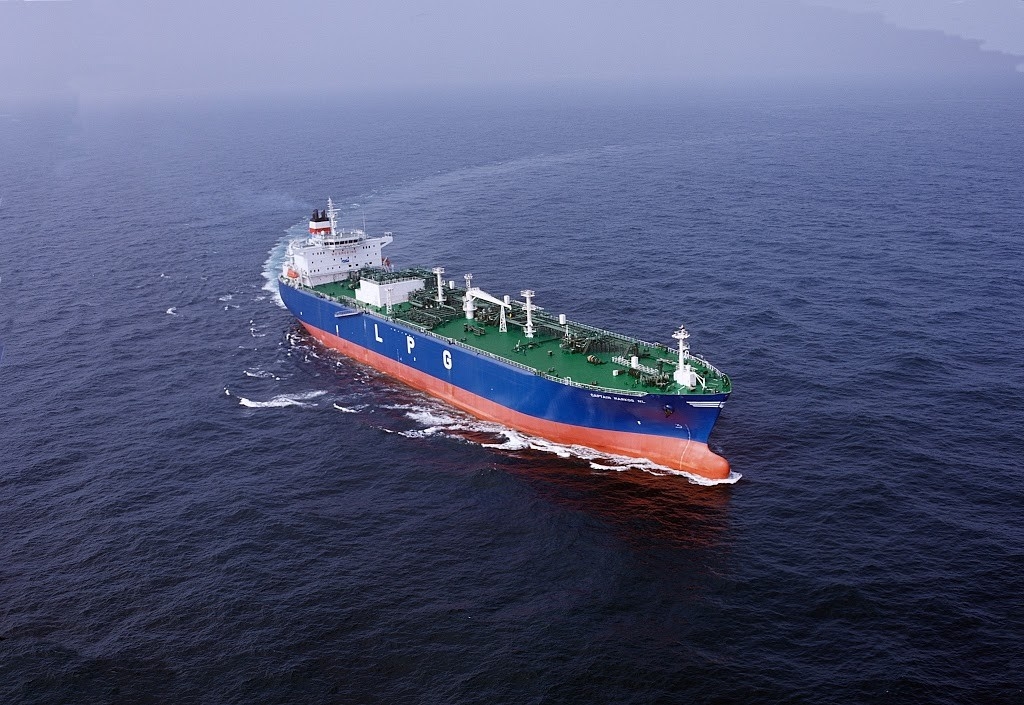
Dorian LPG Ltd., a leading owner and operator of modern very large gas carriers (“VLGCs”), reported its financial results for the three months ended June 30, 2021.
Key Recent Developments
– Announced that our Board of Directors has declared a cash dividend of $1.00 per share of the Company’s common stock. The dividend is payable on or about September 8, 2021 to all shareholders of record as of the close of business on August 9, 2021.
– Classified the debt-free Captain Markos NL as vessel held-for-sale.
Highlights for the First Quarter Fiscal Year 2022
– Revenues of $63.0 million and Time Charter Equivalent (“TCE”)(1) rate for our fleet of $31,571 for the three months ended June 30, 2021, compared to revenues of $73.2 million and TCE rate for our fleet of $41,249 for the three months ended June 30, 2020.
– Net income of $5.9 million, or $0.14 earnings per diluted share (“EPS”), and adjusted net income(1) of $5.4 million, or $0.13 adjusted earnings per diluted share (“adjusted EPS”),(1) for the three months ended June 30, 2021.
– Adjusted EBITDA(1) of $29.8 million for the three months ended June 30, 2021.
John C. Hadjipateras, Chairman, President and Chief Executive Officer of the Company, commented, “The safety of our seafarers and shoreside staff remains paramount. We are grateful for their dedication in these challenging times. We declared our first ever dividend and will continue to look at a variety of ways to return capital to shareholders. In addition, the prospective sale of the Captain Markos NL underscores our commitment to realize value from our asset base.”
First Quarter Fiscal Year 2022 Results Summary
Net income amounted to $5.9 million, or $0.14 per diluted share, for the three months ended June 30, 2021, compared to $12.2 million, or $0.24 per diluted share, for the three months ended June 30, 2020.
Adjusted net income amounted to $5.4 million, or $0.13 per diluted share, for the three months ended June 30, 2021, compared to $12.7 million, or $0.25 per diluted share, for the three months ended June 30, 2020. Net income for the three months ended June 30, 2021 is adjusted to exclude an unrealized gain on derivative instruments of $0.4 million. Please refer to the reconciliation of net income to adjusted net income, which appears later in this press release.
The $7.3 million decrease in adjusted net income for the three months ended June 30, 2021, compared to the three months ended June 30, 2020, is primarily attributable to a decrease of $10.2 million in revenues and increases of $2.9 million in vessel operating expenses, $0.6 million in voyage expenses, $0.2 million in depreciation and amortization, and a $1.4 million unfavorable change in other gain/(loss), net, partially offset by decreases of $3.5 million in interest and finance costs, $3.3 million in general and administrative costs, and $1.2 million in charter hire expenses.
The TCE rate for our fleet was $31,571 for the three months ended June 30, 2021, a 23.5% decrease from a TCE rate of $41,249 for the same period in the prior year, primarily driven by increased bunker costs. Please see footnote 7 to the table in “Financial Information” below for information related to how we calculate TCE. Total fleet utilization (including the utilization of our vessels deployed in the Helios Pool) increased from 82.3% in the quarter ended June 30, 2020 to 96.1% in the quarter ended June 30, 2021.
Vessel operating expenses per day increased to $10,131 for the three months ended June 30, 2021 compared to $8,686 in the same period in the prior year. Please see “Vessel Operating Expenses” below for more information.
Revenues
Revenues, which represent net pool revenues—related party, time charters and other revenues, net, were $63.0 million for the three months ended June 30, 2021, a decrease of $10.2 million, or 14.0%, from $73.2 million for the three months ended June 30, 2020 primarily due to a decrease in average TCE rates and fleet availability despite an increase in fleet utilization. Average TCE rates decreased by $9,678 from $41,249 for the three months ended June 30, 2020 to $31,571 for the three months ended June 30, 2021. We recognized a reallocation of prior period pool profits based on a periodic review of actual vessel performance in accordance with the pool participation agreements. This resulted in a $31 per operating day increase in our fleet’s overall TCE rates for the three months ended June 30, 2021 due to adjustments related to speed and consumption performance of the vessels operating in the Helios Pool. During the three months ended June 30, 2020, we recognized a similar reallocation that resulted in a $916 decrease in our fleet’s overall TCE rates. Excluding these reallocations, TCE rates decreased by $10,625 when comparing the three months ended June 30, 2021 and 2020, primarily driven by higher bunker prices, partially offset by an increase in spot market rates during this period. The average price of very low sulfur fuel oil (expressed as U.S. dollars per metric ton), from Singapore and Fujairah increased from $272 during the three months ended June 30, 2020 to $508 during the three months ended June 30, 2021. The Baltic Exchange Liquid Petroleum Gas Index, an index published daily by the Baltic Exchange for the spot market rate for the benchmark Ras Tanura-Chiba route (expressed as U.S. dollars per metric ton), averaged $52.790 during the three months ended June 30, 2021 compared to an average of $41.484 for the three months ended June 30, 2020. Our fleet utilization increased from 82.3% during the three months ended June 30, 2020 to 96.1% during the three months ended June 30, 2021.
Charter Hire Expenses
Charter hire expenses for the vessels chartered in from third parties were $3.5 million and $4.7 million for the three months ended June 30, 2021 and 2020, respectively. The decrease of $1.2 million, or 25.6%, was caused by a decrease in time chartered-in days from 192 for the three months ended June 30, 2020 to 139 for the three months ended June 30, 2021, due to the redelivery of one time chartered in vessel during the period.
Vessel Operating Expenses
Vessel operating expenses were $20.3 million during the three months ended June 30, 2021, or $10,131 per vessel per calendar day, which is calculated by dividing vessel operating expenses by calendar days for the relevant time-period for the technically-managed vessels that were in our fleet. Vessel operating expenses per vessel per calendar day increased by $1,445 from $8,686 for the three months ended June 30, 2020 to $10,131 for the three months ended June 30, 2021. The increase in vessel operating expenses for the three months ended June 30, 2021, when compared with the three months ended June 30, 2020, was primarily the result of an increase in crew wages and related costs of $2.3 million, or $1,159 per vessel per calendar day, and an increase in operating expenses related to repairs and maintenance, spares and stores, and coolant costs of $0.7 million, or $342 per vessel per calendar day. COVID-19 related expenses were the primary driver of the increase in crew wages and related costs, particularly in crew travel and medical costs.
General and Administrative Expenses
General and administrative expenses were $8.0 million for the three months ended June 30, 2021, a decrease of $3.3 million, or 28.9%, from $11.3 million for the three months ended June 30, 2020. This was driven by reductions of $2.4 million in cash bonuses and $1.3 million in stock-based compensation. The Compensation Committee of our Board of Directors had not yet approved cash bonuses for our named executive officers as of June 30, 2021.
Interest and Finance Costs
Interest and finance costs amounted to $5.6 million for the three months ended June 30, 2021, a decrease of $3.5 million, or 37.8%, from $9.1 million for the three months ended June 30, 2020. The decrease of $3.5 million during this period was due to (1) a decrease of $1.8 million in amortization of deferred financing fees and loan expenses, primarily resulting from accelerated amortization of $2.1 million during the three months ended June 30, 2020 that did not recur in the current period, and (2) a decrease of $1.7 million in interest incurred on our long-term debt, primarily resulting from a reduction of average indebtedness and a reduced margin on the commercial tranche of the 2015 AR Facility due to the results of our Average Efficiency Ratio (which weighs carbon emissions for a voyage against the design deadweight of a vessel and the distance travelled on such voyage). Average indebtedness, excluding deferred financing fees, decreased from $676.0 million for the three months ended June 30, 2020 to $600.0 million for the three months ended June 30, 2021. As of June 30, 2021, the outstanding balance of our long-term debt, net of deferred financing fees of $10.0 million, was $579.1 million.
Unrealized Gain/(Loss) on Derivatives
Unrealized gain on derivatives amounted to $0.4 million for the three months ended June 30, 2021, compared to $0.5 million loss for the three months ended June 30, 2020. The favorable $0.9 million difference is primarily attributable to an increase in favorable fair value changes to our interest rate swaps resulting from changes in forward LIBOR yield curves.
Market Outlook & Update
Global seaborne LPG supply increased an estimated 1.5 million tons during the second calendar quarter of 2021 compared to the first calendar quarter of 2021 and a 6% increase from the same period of 2020. The majority of this increase was from the U.S. where exports reached an average of 4.4 million tons per month in the second calendar quarter of 2021. Middle Eastern LPG seaborne supply remained relatively constant with production cuts and Iranian Sanctions remaining in place.
Crude oil prices rose throughout the second calendar quarter of 2021 with Brent averaging approximately $69 per barrel, compared to $32 per barrel during the same period in 2020. Flat prices of propane and butane consequently rose, however, the percentage of propane and butane compared to crude oil dropped from the previous quarter across all major regions.
With higher seaborne supply, imports into the major consuming regions rose particularly to China, where LPG imports increased from around 5.7 million tons during the first calendar quarter of 2021 to 6.5 million tons during the second calendar quarter of 2021. After two new propane dehydrogenation plants began operating in the first calendar quarter of 2021, a new steam cracker utilizing imported propane as the feedstock started production in April 2021.
Petrochemical margins increased throughout the first calendar quarter of 2021 and this trend continued into the second calendar quarter of 2021 as a number of facilities did not return to full operation after being shut in the first quarter. This was most noticeable in the western hemisphere. Consumption of LPG as a feedstock for petrochemicals increased in the second calendar quarter of 2021 compared to the first quarter with propane favored as a feedstock for the production of ethylene over naphtha. The propane-naphtha spread in north-western Europe widened to -$90 per ton on average in the second calendar quarter of 2021, compared to an average of -$23 per ton during the first quarter. Towards the end of the second quarter, however, margins for the production of ethylene via steam cracking started to decline, with the largest declines in the eastern hemisphere.
The Baltic VLGC index averaged around $53 per ton in the second calendar quarter of 2021, only $2 per ton below the performance of the Baltic Index as of the first calendar quarter of 2021.
Currently, the VLGC orderbook stands at approximately 22% of the current global fleet. An additional 70 VLGCs, equivalent to roughly 6.2 million cbm of carrying capacity, are expected to be added to the global fleet by calendar year-end 2023. The average age of the global fleet is now approximately 10 years old.
View Full Report
Dorian LPG in its strongest position to date says John Hadjipateras
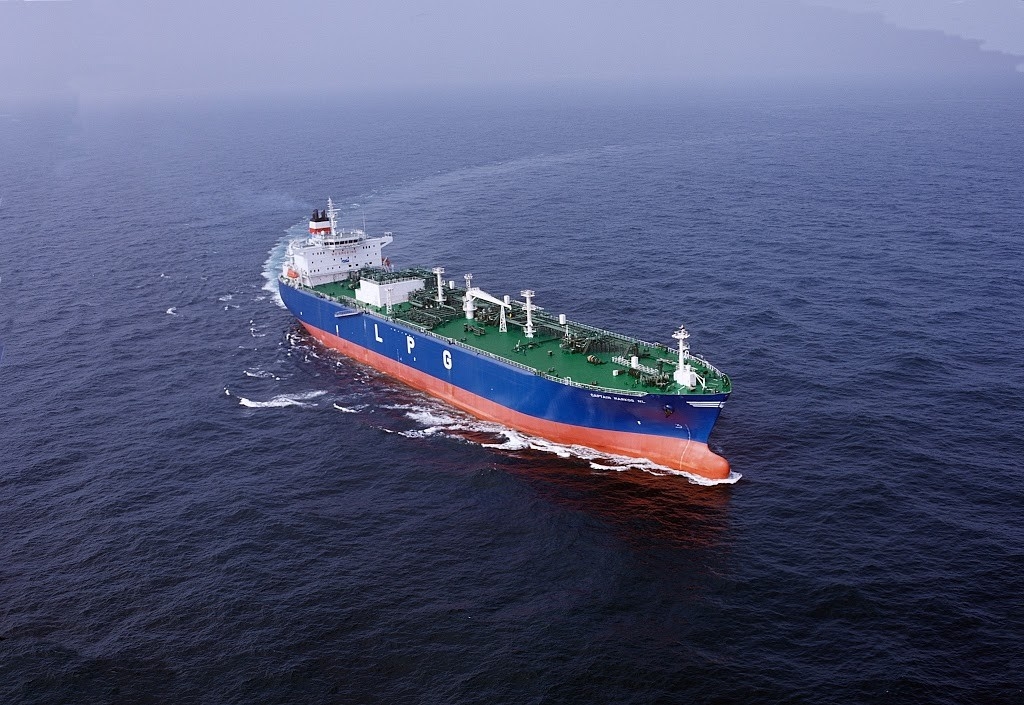
Dorian LPG Ltd., a leading owner and operator of modern very large gas carriers (“VLGCs”), reported its financial results for the three months and fiscal year ended March 31, 2021.
Highlights for the Fourth Quarter Ended March 31, 2021
• Revenues of $99.6 million.• Time charter equivalent (“TCE”)(1) per operating day rate for our fleet of $49,474.• Net income of $44.0 million, or $0.93 earnings per diluted share (“EPS”), and adjusted net income(1) of $40.8 million, or $0.86 adjusted diluted earnings per share (“adjusted EPS”)(1).• Adjusted EBITDA(1) of $65.0 million.• Repurchased 8.4 million shares, or approximately 16.8% of our then outstanding common shares, pursuant to our previously announced tender offer.• Expect to take delivery in March 2023 of an 84,000 cubic meter dual fuel VLGC from Kawasaki Heavy Industries under a Japanese financing arrangement.
Highlights for the Fiscal Year Ended March 31, 2021
• Revenues of $315.9 million.• TCE(1) per operating day rate for our fleet of $39,606.• Net income of $92.6 million, or $1.86 EPS, and adjusted net income(1) of $85.4 million, or $1.71 adjusted EPS(1).• Adjusted EBITDA(1) of $188.6 million.• Repurchased over $124.8 million of our common stock, or approximately 9.6 million shares, between our previously announced tender offer and common share repurchase program.
(1) TCE, adjusted net income, adjusted EPS and adjusted EBITDA are non-GAAP measures. Refer to the reconciliation of revenues to TCE, net income to adjusted net income, EPS to adjusted EPS and net income to adjusted EBITDA included later in this press release.
John Hadjipateras, Chairman, President and Chief Executive Officer of the Company, commented, “Though the past year presented major challenges relating to the pandemic, the commitment of our nearly eight hundred seafarers, five hundred presently at sea, as well as the dedication of our shore-side staff, we believe has put Dorian LPG in its strongest position to date. Upsizing our $100 million self-tender offer by 13.5% to repurchase 8.4 million shares demonstrates our strong commitment to returning shareholder capital.”
Fourth Quarter Fiscal Year 2021 Results Summary
Our net income amounted to $44.0 million, or $0.93 per share, for the three months ended March 31, 2021, compared to net income of $29.4 million, or $0.56 per share, for the three months ended March 31, 2020.
Our adjusted net income amounted to $40.8 million, or $0.86 per share, for the three months ended March 31, 2021, compared to adjusted net income of $42.3 million, or $0.81 per share, for the three months ended March 31, 2020. We have adjusted our net income for the three months ended March 31, 2021 for an unrealized gain on derivative instruments of $3.3 million. We adjusted our net income for the three months ended March 31, 2020 for an unrealized loss on derivative instruments of $12.9 million. Please refer to the reconciliation of net income to adjusted net income, which appears later in this press release.
The $1.5 million decrease in adjusted net income for the three months ended March 31, 2021 compared to the three months ended March 31, 2020 is primarily attributable to (1) increases of $5.4 million in general and administrative expenses (inclusive of a contingent liability and corresponding expense of $4.0 million during the three months ended March 31, 2021), $1.4 million in vessel operating expenses, $0.8 million in charter hire expenses from our chartered-in VLGCs and $0.3 million depreciation and amortization; and (2) an unfavorable change of $1.5 million in realized gain/(loss) on derivatives; partially offset by an increase in revenues of $4.4 million and a decrease in interest and finance costs of $2.5 million.
The TCE rate for our fleet was $49,474 for the three months ended March 31, 2021, a 4.7% decrease from the $51,888 TCE rate for the same period in the prior year, as further described in “Revenues” below. Please see footnote 6 to the table in “Financial Information” below for other information related to how we calculate TCE. Total fleet utilization (including the utilization of our vessels deployed in the Helios Pool) increased from 91.7% in the three months ended March 31, 2020 to 95.3% in the three months ended March 31, 2021.
Vessel operating expenses per day increased to $10,198 during the three months ended March 31, 2021 from $9,407 in the same period in the prior year. Please see “Vessel Operating Expenses” below for more information.
Revenues
Revenues, which represent net pool revenues—related party, time charters and other revenues earned by our vessels, were $99.6 million for the three months ended March 31, 2021, an increase of $4.4 million, or 4.6%, from $95.2 million for the three months ended March 31, 2020. The increase was primarily attributable to an increase in fleet utilization, which increased from 91.7% during the three months ended March 31, 2020 to 95.3% during the three months ended March 31, 2021. Increased utilization was partially offset by slightly reduced TCE rates, which were $49,474 for the three months ended March 31, 2021 compared to $51,888 for the three months ended March 31, 2020. During the three months ended March 31, 2021, we recognized a reallocation of prior period pool profits based on a periodic review of actual vessel performance in accordance with the pool participation agreements. This reallocation resulted in a $55 increase in our fleet’s overall TCE rates for the three months ended March 31, 2021 due to adjustments related to the relative speed and consumption performance of all vessels participating in the Helios Pool. This compares to a $1,019 increase in our fleet’s overall TCE rates for reallocation of prior period pool profits during the three months ended March 31, 2020. Excluding this reallocation for both periods, TCE rates decreased by $1,450 when comparing the three months ended March 31, 2021 to the three months ended March 31, 2020, primarily due to a reduction of spot market rates. The Baltic Exchange Liquid Petroleum Gas Index, an index published daily by the Baltic Exchange for the spot market rate for the benchmark Ras Tanura-Chiba route (expressed as U.S. dollars per metric ton), averaged $54.260 during the three months ended March 31, 2021 compared to an average of $66.662 for the three months ended March 31, 2020.
Charter Hire Expenses
Charter hire expenses for vessels time chartered-in from third parties were $4.5 million for three months ended March 31, 2021 compared to $3.7 million for the three months ended March 31, 2020. The increase of $0.8 million, or 22.5%, was caused by an increase in time chartered-in days, which increased from 151 for the three months ended March 31, 2020 to 180 for the three months ended March 31, 2021.
Vessel Operating Expenses
Vessel operating expenses were $20.2 million during the three months ended March 31, 2021, or $10,198 per vessel per calendar day, which is calculated by dividing vessel operating expenses by calendar days for the relevant time period for the vessels that were in our fleet. This was an increase of $1.4 million, or 7.2%, from $18.8 million, or $9,407 per vessel per calendar day, for the three months ended March 31, 2020. The increase in vessel operating expenses was primarily the result of an increase in crew wages and related costs of $0.9 million, or $532 per vessel per calendar day, and an increase of $0.7 million, or $382 per vessel per calendar day, in repairs and maintenance costs.
General and Administrative Expenses
General and administrative expenses were $11.1 million for the three months ended March 31, 2021, an increase of $5.4 million, or 95.7%, from $5.7 million for the three months ended March 31, 2020. The increase was driven by the recording of a contingent liability of $4.0 million related to a disputed claim relating to one of our VLGCs readiness to lift a cargo scheduled by a charterer and increases of $1.1 million in salaries, wages and benefits, and $0.3 million in higher insurance premiums.
Interest and Finance Costs
Interest and finance costs amounted to $5.8 million for the three months ended March 31, 2021, a decrease of $2.5 million, or 30.9%, from $8.3 million for the three months ended March 31, 2020. The decrease of $2.5 million during the three months ended March 31, 2021 was mainly due a decrease of interest incurred on our long-term debt, primarily resulting from a decrease in average indebtedness and a reduced margin from the refinancing of the commercial tranche of the 2015 AR Facility. Average indebtedness, excluding deferred financing fees, decreased from $659.8 million for the three months ended March 31, 2020 to $612.8 million for the three months ended March 31, 2021. As of March 31, 2021, the outstanding balance of our long-term debt, excluding deferred financing fees, was $602.1 million.
Unrealized Gain/(Loss) on Derivatives
Unrealized gain on derivatives amounted to approximately $3.3 million for the three months ended March 31, 2021, compared to a $12.9 million loss for the three months ended March 31, 2020. The favorable $16.2 million difference is primarily attributable to an increase of $12.0 million in the fair value of our interest rate swaps caused by changes in forward LIBOR yield curves and $4.2 million in favorable variances related to our forward freight agreement (“FFA”) positions settled prior to the three months ended March 31, 2021.
Realized Gain/(Loss) on Derivatives
Realized loss on derivatives was $0.9 million for the three months ended March 31, 2021, compared to a realized gain of $0.6 million for the three months ended March 31, 2020. The unfavorable $1.5 million change is primarily attributable to (1) fluctuations in floating LIBOR resulting in a $1.1 million unfavorable variance on realized losses in the current period on our interest rate swaps and (2) prior period settlements on our FFA positions of $0.4 million that did not recur as our FFA positions were all settled prior to the three months ended March 31, 2021.
Fiscal Year 2021 Results Summary
Our net income amounted to $92.6 million, or $1.86 per share, for the year ended March 31, 2021, compared to net income of $111.8 million, or $2.07 per share, for the year ended March 31, 2020.
Our adjusted net income amounted to $85.4 million, or $1.71 per share, for the year ended March 31, 2021, compared to adjusted net income of $130.0 million, or $2.41 per share, for the year ended March 31, 2020. We have adjusted our net income for the year ended March 31, 2021 for an unrealized gain on derivative instruments of $7.2 million. We have adjusted our net income for the year ended March 31, 2020 for an unrealized loss on derivatives of $18.2 million. Please refer to the reconciliation of net income to adjusted net loss, which appears later in this press release.
The unfavorable change of $44.6 million in adjusted net income for the year ended March 31, 2021 compared to the year ended March 31, 2020 is primarily attributable to (1) a decrease in revenues of $17.5 million; (2) increases of $10.5 million in general and administrative costs (inclusive of a contingent liability and corresponding expense of $4.0 million during the year ended March 31, 2021), $8.2 million in charter hire expenses from our chartered-in VLGCs, $6.7 million in vessel operating expenses, and $2.2 million in depreciation and amortization; and (3) an unfavorable change of $7.4 million in realized gain/(loss) on derivatives; partially offset by a decrease of $8.5 million in interest and finance costs.
The TCE rate for our fleet was $39,606 for the year ended March 31, 2021, a 7.5% decrease from the $42,798 TCE rate from the prior year, as further described in “Revenues” below. Please see footnote 6 to the table in “Financial Information” below for other information related to how we calculate TCE. Total fleet utilization (including the utilization of our vessels deployed in the Helios Pool) decreased from 95.4% in the year ended March 31, 2020 to 92.8% in the year ended March 31, 2021.
Vessel operating expenses per day increased to $9,741 in the year ended March 31, 2021 from $8,877 in the prior year. Please see “Vessel Operating Expenses” below for more information.
Revenues
Revenues, which represent net pool revenues—related party, time charters and other revenues, net, were $315.9 million for the year ended March 31, 2021, a decrease of $17.5 million, or 5.2%, from $333.4 million for the year ended March 31, 2020. The decrease is primarily attributable to a reduction of average TCE rates and decreased fleet utilization. Average TCE rates of $39,606 for the year ended March 31, 2021 decreased from $42,798 for the year ended March 31, 2020. During the year ended March 31, 2021, we recognized a reallocation of prior period pool profits based on a periodic review of actual vessel performance in accordance with the pool participation agreements. This reallocation resulted in a $707 decrease in our fleet’s overall TCE rates for the year ended March 31, 2021 due to adjustments related to the relative speed and consumption performance of all vessels participating in the Helios Pool. This compares to a $240 increase in our fleet’s overall TCE rates for reallocation of prior period pool profits during the year ended March 31, 2020. Excluding this reallocation for both years, TCE rates decreased by $2,245 when comparing the year ended March 31, 2021 to the year ended March 31, 2020, primarily driven by a reduction in spot market rates. The Baltic Exchange Liquid Petroleum Gas Index, an index published daily by the Baltic Exchange for the spot market rate for the benchmark Ras Tanura-Chiba route (expressed as U.S. dollars per metric ton), averaged $55.703 for the year ended March 31, 2021 compared to an average of $67.050 for the year ended March 31, 2020. Our fleet utilization decreased from 95.4% during the year ended March 31, 2020 to 92.8% during the year ended March 31, 2021.
Charter Hire Expenses
Charter hire expenses for the vessels chartered in from third parties were $18.1 million for the year ended March 31, 2021 compared to $9.9 million for the year ended March 31, 2020. The increase of $8.2 million, or 83.9%, was caused by an increase in time chartered-in days, which increased from 426 for the year ended March 31, 2020 to 740 for the year ended March 31, 2021.
Vessel Operating Expenses
Vessel operating expenses were $78.2 million during the year ended March 31, 2021, or $9,741 per vessel per calendar day, which is calculated by dividing vessel operating expenses by calendar days for the relevant time period for the vessels that were in our fleet. This was an increase of $6.7 million, or 9.4%, from $71.5 million, or $8,877 per vessel per calendar day, for the year ended March 31, 2020. The increase in vessel operating expenses was primarily the result of a $6.0 million, or $755 per vessel per calendar day, increase in operating expenses related to repairs and maintenance, spares and stores, and coolant costs, which is inclusive of an increase of $0.4 million, or $54 per vessel per calendar day, in operating expenses related to the drydocking of vessels.
General and Administrative Expenses
General and administrative expenses were $33.9 million for the year ended March 31, 2021, an increase of $10.5 million, or 45.1%, from $23.4 million for the year ended March 31, 2020. This was driven by the recording of a contingent liability of $4.0 million related to a disputed claim relating to one of our VLGCs readiness to lift a cargo scheduled by a charterer and increases of $2.0 million in annual cash bonuses to certain employees, $3.1 million in salaries, wages and benefits, and $1.4 million in higher insurance premiums.
Interest and Finance Costs
Interest and finance costs amounted to $27.6 million for the year ended March 31, 2021, a decrease of $8.5 million from $36.1 million for the year ended March 31, 2020. The decrease of $8.5 million during the year ended March 31, 2021 was due to a decrease of $10.6 million in interest incurred on our long-term debt, primarily resulting from a decrease in average indebtedness and a reduced margin from the refinancing of the commercial tranche of the $758 million debt facility that we entered into in March 2015 with a group of banks and financial institutions, partially offset by a reduction of $2.2 million in amortization of deferred financing fees and loan expenses. Average indebtedness, excluding deferred financing fees, decreased from $683.9 million for the year ended March 31, 2020 to $633.7 million for the year ended March 31, 2021. As of March 31, 2021, the outstanding balance of our long-term debt, excluding deferred financing fees, was $602.1 million.
Unrealized Gain/(Loss) on Derivatives
Unrealized gain on derivatives amounted to approximately $7.2 million for the year ended March 31, 2021 compared to an unrealized loss of $18.2 million for the year ended March 31, 2020. The favorable $25.4 million difference is primarily attributable to an increase of $20.2 million in favorable fair value changes to our interest rate swaps resulting from changes in forward LIBOR yield curves and $5.2 million in favorable variances related to the settlement in the current period of our FFA positions.
Realized Gain/(Loss) on Derivatives
Realized loss on derivatives was $4.6 million for the year ended March 31, 2021, compared to a realized gain of $2.8 million for the year ended the year ended March 31, 2020. The unfavorable $7.4 million change is primarily attributable to (1) fluctuations in floating LIBOR resulting in a $6.2 million unfavorable variance on realized losses in the current period on our interest rate swaps and (2) additional realized losses incurred related to settlements on our FFA positions of $1.2 million.
Fleet
The following table sets forth certain information regarding our fleet as of May 18, 2021. We classify vessel employment as either Time Charter, Pool or Pool-TCO.
(1)Represents vessels with very low revolutions per minute, long–stroke, electronically controlled engines, larger propellers, advanced hull design, and low friction paint.
(2)Represents calendar year quarters.
(3)Operated pursuant to a bareboat chartering agreement.
(4)”Pool” indicates that the vessel operates in the Helios Pool on a voyage charter with a third party and we receive a portion of the pool profits calculated according to a formula based on the vessel’s pro rata performance in the pool.
(5)”Pool-TCO” indicates that the vessel is operated in the Helios Pool on a time charter out to a third party and we receive a portion of the pool profits calculated according to a formula based on the vessel’s pro rata performance in the pool.
(6)Currently on a time charter with an oil major that began in November 2019.
(7)Currently on time charter with a major oil company that began in March 2019.
(8)Currently time chartered-in to our fleet with an expiration during the first calendar quarter of 2023.
Market Outlook Update
Global seaborne LPG volumes during the first calendar quarter of 2021 decreased 1.7% year-over-year to 26.5 million tons. U.S. seaborne LPG exports, however, grew by 7.1% over the same period to 11.8 million tons. Elevated U.S. exports were balanced by slightly declining Middle Eastern export volumes. Exports from the Middle East totaled 8.6 million tons of LPG during the quarter, a 6.6% year-over-year decrease.
During the quarter, Indian LPG imports reached a record high of 4.5 million tons, a 17.4% year-over-year increase, due in part to government plans to expand LPG connections by 10 million households in the east of the country. In China, the startup of three PDH plants with 1.9 million tons of annual throughput contributed to year-over-year growth of 14.6% to 4.6 million tons for the quarter. Import demand in Japan and South Korea, however, decreased following increased inventories resulting from heightened weather-related demand in the previous quarter.
For the first calendar quarter, the Baltic VLGC Index averaged $54 per metric ton, reaching a quarterly high of $119 per metric ton in early January. For the second calendar quarter to date, the Baltic Index has averaged $55 per metric ton.
Currently the VLGC orderbook stands at approximately 20% of the current global fleet. An additional 62 VLGCs, equivalent to roughly 5.5 million cbm of carrying capacity, are expected to be added to the global fleet by calendar year-end 2023. The average age of the global fleet is now approximately ten years old.
The above market outlook update is based on information, data and estimates derived from industry sources, and there can be no assurances that such trends will continue or that anticipated developments in freight rates, export volumes, the VLGC orderbook or other market indicators will materialize. This information, data and estimates involve a number of assumptions and limitations, are subject to risks and uncertainties, and are subject to change based on various factors. You are cautioned not to give undue weight to such information, data and estimates. We have not independently verified any third-party information or verified that more recent information is not available.
Seasonality
Liquefied gases are primarily used for industrial and domestic heating, as a chemical and refinery feedstock, as a transportation fuel and in agriculture. The LPG shipping market historically has been stronger in the spring and summer months in anticipation of increased consumption of propane and butane for heating during the winter months. In addition, unpredictable weather patterns in these months tend to disrupt vessel scheduling and the supply of certain commodities. Demand for our vessels therefore may be stronger in the quarters ending June 30 and September 30 and relatively weaker during the quarters ending December 31 and March 31, although 12-month time charter rates tend to smooth these short-term fluctuations and recent LPG shipping market activity has not yielded the expected seasonal results. To the extent any of our time charters expire during the typically weaker fiscal quarters ending December 31 and March 31, it may not be possible to re-charter our vessels at similar rates. As a result, we may have to accept lower rates or experience off-hire time for our vessels, which may adversely impact our business, financial condition and operating results.
Dorian LPG (DK) ApS signs contract to install Kongsberg Digital’s Vessel Insight on LPG Carrier fleet
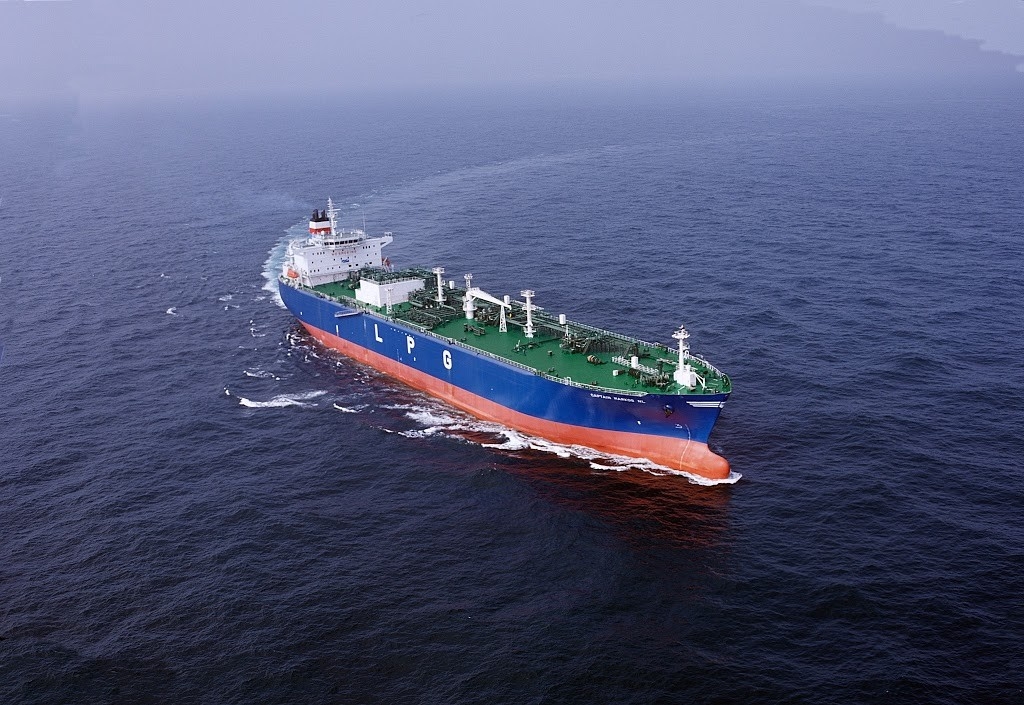
Kongsberg Digital announced today that Dorian LPG (DK) ApS, a subsidiary of Dorian LPG Ltd. (Dorian), which is a leading owner and operator of modern VLGCs, has contracted to install Vessel Insight to its entire fleet of 22 LPG carriers. By installing Vessel Insight, Dorian is consolidating collection of all critical data from its vessels into one common infrastructure. The agreement is expected to commence operation in the upcoming months.
With the installation of Vessel Insight, Dorian plans to collect all critical data from its entire VLGC (Very Large Gas Carrier) fleet. The purpose is to gain insight into signals coming from the fleet’s assets and enable realization of data-driven operations. The Vessel Insight data infrastructure solution is based on open principles and allows owners and operators to partner with software providers of their choosing.
Data-driven approach to reducing carbon footprint
Dorian’s initial plan is to monitor and predict consumption and emissions data to plan for IMO 2023 regulations, which will require vessels to combine technical and operational approaches in order to reduce their carbon emissions. Dorian also seeks to benchmark the performance between vessel types in their fleet.
“Since going public in 2013, Dorian LPG Ltd. has been a forerunner in adopting the latest technologies within the maritime industry, and we are very happy to continue that trend by delivering Vessel Insight to their fleet. This contract emphasizes the untapped potential and value of collecting data to analyze, predict and improve processes for vessels and fleets, especially given the current situation within the maritime industry, where gaining a competitive edge and decarbonizing while meeting new regulations is key to survival and success. Vessel Insight will ensure that Dorian is properly equipped to meet their goals,” says Andreas Jagtøyen, Executive Vice President Digital Ocean, Kongsberg Digital.
The exponential growth in data currently being made available amplifies the opportunity for vessel owners to be more insight-led in their decision making. However, many struggle to realize tangible and measurable value from data, making the data capture and aggregation provided by Vessel Insight powerful tools for success. Having access to data and the expertise in deriving meaningful insights from it is key, especially now that the maritime industry is witnessing a shift towards more energy-efficient vessels led by constantly stricter IMO regulations.
“We are pleased to be partnering with Kongsberg Digital on this important initiative. In surveying the market, we felt that Kongsberg Digital had developed a great product that meets our needs and should begin to deliver results promptly,” says John C. Lycouris, CEO, Dorian LPG (USA) LLC.
The contract between Kongsberg Digital and Dorian LPG (DK) ApS was signed on 4th March 2021, and Vessel Insight is expected to be installed on all 22 vessels in the upcoming months.
Dorian LPG Ltd. to Commence Tender Offer to Repurchase Up to $100 Million of its Common Shares
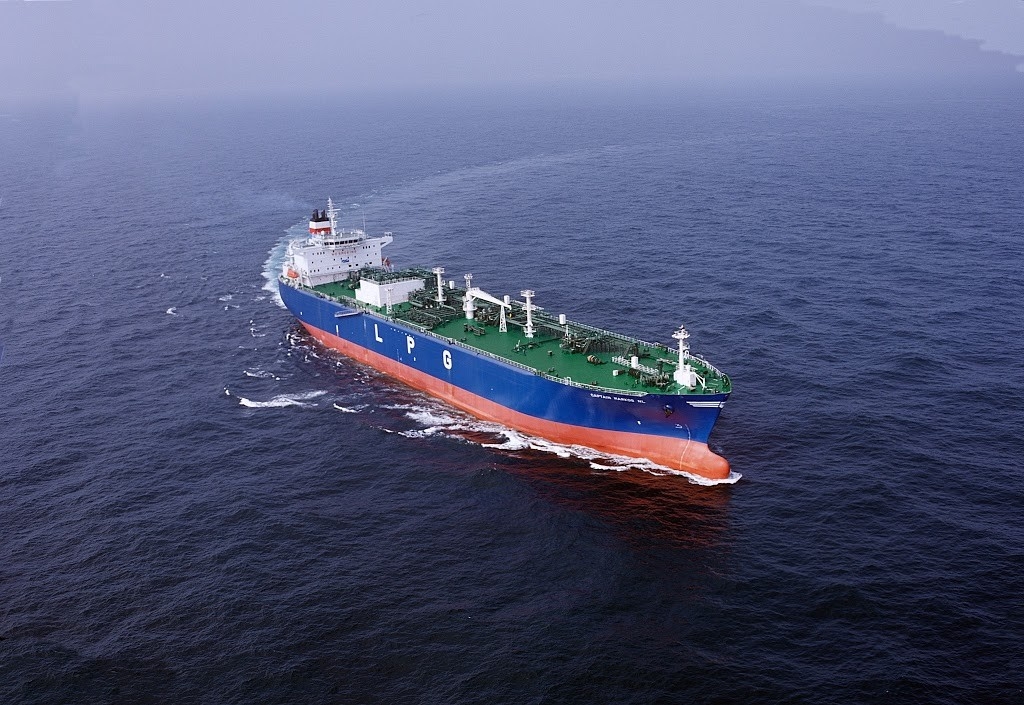
Dorian LPG Ltd., a leading owner and operator of modern very large gas carriers (“VLGCs”), announced that it will today commence a tender offer to purchase up to 7,407,407, or about 14.8%, of its outstanding common shares using funds available from cash and cash equivalents at a price of $13.50 per share. The tender offer will expire at the end of the day, 5:00 P.M., Eastern Time, on March 3, 2021, unless extended or withdrawn. The Board of Directors determined that it is in the Company’s best interest to repurchase shares at this time given the Company’s cash position and stock price.
Pursuant to the tender offer, the Company’s stockholders may tender all or a portion of their shares. Stockholders will receive the purchase price in cash, subject to applicable withholding and without interest, subject to the conditions of the tender offer, including the provisions relating to proration and conditional tenders in the event that the number of shares properly tendered and not properly withdrawn exceeds 7,407,407. These provisions are described in the Offer to Purchase and in the Letter of Transmittal relating to the tender offer that will be filed with the U.S. Securities and Exchange Commission. The tender offer is not conditioned upon the receipt of financing, but is subject to certain other conditions. Specific instructions and an explanation of the terms and conditions of the tender offer are contained in the Offer to Purchase and related materials that will be mailed to shareholders.
Dorian LPG has retained Computershare Trust Company, N.A. as the depositary for the tender offer and Georgeson LLC as the information agent.
Copies of the Offer to Purchase, the related Letter of Transmittal and the Notice of Guaranteed Delivery will be mailed to the Company’s shareholders. Shareholders who would like to obtain a copy of these documents, without charge, or who have any questions, may direct their inquiries to Georgeson LLC, the information agent for the tender offer, toll free at +1 (866) 647-8872. Shareholders are urged to carefully read all of these materials prior to making any decision with respect to the tender offer.
Dorian LPG is a liquefied petroleum gas shipping company and a leading owner and operator of modern VLGCs. Dorian LPG’s fleet currently consists of 24 modern VLGCs. Dorian LPG has offices in Stamford, Connecticut, USA; London, United Kingdom; Copenhagen, Denmark; and Athens, Greece.
Dorian LPG Ltd. Reports Quarterly Rise of Revenues by 55%, on Healthy Rates
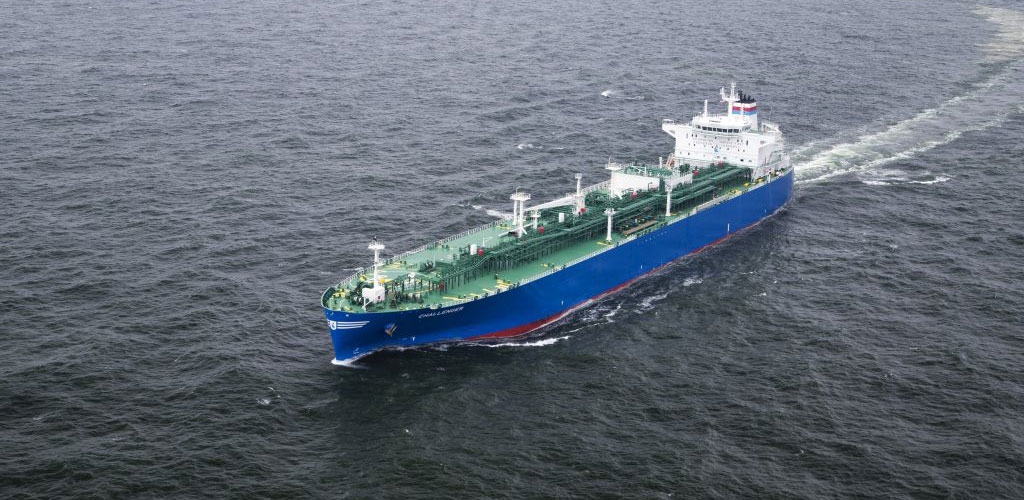
Dorian LPG Ltd., a leading owner and operator of modern very large gas carriers (“VLGCs”), yesterday reported its financial results for the three and nine months ended December 31, 2019.
Highlights for the Third Quarter Fiscal Year 2020
• Revenues of $85.4 million and Time Charter Equivalent (“TCE”)(1) rate for our fleet of $43,410 for the three months ended December 31, 2019, compared to revenues of $55.1 million and TCE rate for our fleet of $30,108 for the three months ended December 31, 2018.
• Net income of $35.6 million, or $0.66 earnings per diluted share (“EPS”), and adjusted net income(1) of $34.2 million, or $0.63 adjusted earnings per diluted share (“adjusted EPS”),(1) for the three months ended December 31, 2019.
• Adjusted EBITDA(1) of $59.9 million for the three months ended December 31, 2019.
• Completed the installation of exhaust gas cleaning systems (commonly referred to as “scrubbers”) on the Constellation, Cresques) and the Copernicus(2)
• Time chartered-in the 2020-built, hybrid scrubber-fitted Future Diamond(3) to our fleet with an expiration during the first calendar quarter of 2023.
• Repurchased $8.6 million of shares of our common stock during the three months ended December 31, 2019 under the $50 million stock repurchase program our Board of Directors authorized on August 5, 2019.
• Board of Directors authorized an increase to our stock repurchase program to repurchase up to an additional $50 million of our common stock.
(1) TCE, adjusted net income, adjusted EPS and adjusted EBITDA are non-U.S. GAAP measures. Refer to the reconciliation of revenues to TCE, net income to adjusted net income, EPS to adjusted EPS and net income to adjusted EBITDA included in this press release under the heading “Financial Information.”
(2) Copernicus left drydock in January 2020.
(3) Future Diamond was chartered-in beginning February 1, 2020
John C. Hadjipateras, Chairman, President and Chief Executive Officer of the Company, commented, “Rates are healthy and the VLGC orderbook has been stable. With a young, fuel-efficient fleet, more than half of which will be scrubber equipped in the coming months, IMO 2020 has strengthened our market position. Quarterly revenue has increased 55%, while adjusted EBITDA has more than doubled compared to the same period last year. Our Board’s decision to increase the repurchase authorization reflects our constructive view of the industry outlook and our disciplined approach to capital allocation where we see discounts to our intrinsic value.”
Third Quarter Fiscal Year 2020 Results Summary
Net income amounted to $35.6 million, or $0.66 per diluted share, for the three months ended December 31, 2019, compared to a net loss of $(6.2) million, or $(0.11) per diluted share, for the three months ended December 31, 2018
Adjusted net income amounted to $34.2 million, or $0.63 per diluted share, for the three months ended December 31, 2019, compared to adjusted net income of $0.5 million, or $0.01 per diluted share, for the three months ended December 31, 2018. Net income for the three months ended December 31, 2019 is adjusted to exclude an unrealized gain on derivative instruments of $1.4 million. Please refer to the reconciliation of net income/(loss) to adjusted net income/(loss), which appears later in this press release.
The $33.7 million increase in adjusted net income for the three months ended December 31, 2019, compared to the three months ended December 31, 2018, is primarily attributable (i) to an increase of $30.3 million in revenues, (ii) professional and legal fees related to the BW Proposal (defined below) of $7.8 million that did not recur, and (iii) a decrease of $1.2 million in interest and finance costs, partially offset by (iv) increases of $2.1 million in charter hire expenses, $2.3 million in vessel operating expenses, $0.9 million in voyage expenses, and (v) a decrease of $0.5 million in realized gain on derivatives.
The TCE rate for our fleet was $43,410 for the three months ended December 31, 2019, a 44.2% increase from a TCE rate of $30,108 from the same period in the prior year, primarily driven by increased spot market rates partially offset by bunker prices. Please see footnote 6 to the table in “Financial Information” below for information related to how we calculate TCE. Total fleet utilization (including the utilization of our vessels deployed in the Helios Pool) increased from 90.0% in the quarter ended December 31, 2018 to 98.4% in the quarter ended December 31, 2019.
Vessel operating expenses per day increased to $9,452 for the three months ended December 31, 2019 $8,287 in the same period in the prior year. Please see “Vessel Operating Expenses” below for more information.
Revenues
Revenues, which represent net pool revenues—related party, time charters and other revenues earned by our vessels, were $85.4 million for the three months ended December 31, 2019, an increase of $30.3 million, or 55.0%, from $55.1 million for the three months ended December 31, 2018. The increase is primarily attributable to an increase in average TCE rates and fleet utilization. Average TCE rates increased from $30,108 for the three months ended December 31, 2018 to $43,410 for the three months ended December 31, 2019, primarily as a result of higher spot market rates during the three months ended December 31, 2019 as compared to the three months ended December 31, 2018, partially offset by an increase in bunker prices when comparing these periods. The Baltic Exchange Liquid Petroleum Gas Index, an index published daily by the Baltic Exchange for the spot market rate for the benchmark Ras Tanura-Chiba route (expressed as U.S. dollars per metric ton), averaged $73.300 during the three months ended December 31, 2019 compared to an average of $42.389 for the three months ended December 31, 2018. The average price of heavy fuel oil (expressed as U.S. dollars per metric tonnes) from Singapore and Fujairah increased from $466 during the three months ended December 31, 2018 to $473 during the three months ended December 31, 2019. Our fleet utilization increased from 90.0% during the three months ended December 31, 2018 to 98.4% during the three months ended December 31, 2019.
View Full Report