
Chubb Reports Second Quarter Per Share Net Income of $7.30 and Per Share Core Operating Income of $7.26, Up 18.2%; Consolidated Net Premiums Written of $14.7 Billion, Up 3.6%, with P&C and Life Insurance Up 3.0% and 7.5%; P&C Combined Ratio of 83.8%

Chubb Limited (NYSE: CB) reported net income for the quarter ended June 30, 2026 of $2.85 billion, or $7.30 per share, and core operating income of $2.84 billion, or $7.26 per share. Book value per share and tangible book value per share increased 12.3% and 17.1%, respectively, from June 30, 2025 and now stand at $195.45 and $131.93. For the last three months, book value was favorably impacted by after-tax net realized and unrealized gains of $388 million in Chubb’s investment portfolio, partially offset by $254 million of foreign currency losses. Book value per share and tangible book value per share excluding AOCI increased 11.4% and 15.8%, from June 30, 2025.
Chubb Limited
Second Quarter Summary
(in millions of U.S. dollars, except per share amounts and ratios)
(Unaudited)
(Per Share)
2026
2025
Change
2026
2025
Change
Net income
$2,854
$2,968
(3.8) %
$7.30
$7.35
(0.7) %
Adjusted net realized (gains) losses and other,
net of tax
(47)
(539)
(91.3) %
(0.13)
(1.33)
(90.2) %
Integration expenses and severance, net of tax
6
2
NM
0.02
–
NM
Market risk benefits (gains) losses, net of tax
(4)
15
NM
(0.01)
0.04
NM
Amortization of deferred tax asset from Bermuda law
33
34
(2.9) %
0.08
0.08
–
Core operating income, net of tax
$2,842
$2,480
14.6 %
$7.26
$6.14
18.2 %
Annualized return on equity (ROE)
15.3 %
17.6 %
Core operating return on tangible equity (ROTE)
21.2 %
21.0 %
Core operating ROE
14.5 %
13.9 %
For the six months ended June 30, 2026, net income was $5.17 billion, or $13.17 per share, and core operating income was $5.53 billion, or $14.07 per share. Book value per share and tangible book value per share increased by 3.6% and 4.5%, from December 31, 2025. For the last six months, book value was unfavorably impacted by after-tax net realized and unrealized losses of $1.55 billion in Chubb’s investment portfolio, partially offset by $92 million of foreign currency gains. Book value per share and tangible book value per share excluding AOCI increased 4.7% and 6.4%, from December 31, 2025.
Chubb Limited
Six Months Ended Summary
(in millions of U.S. dollars, except per share amounts and ratios)
(Unaudited)
(Per Share)
2026
2025
Change
2026
2025
Change
Net income
$5,174
$4,299
20.4 %
$13.17
$10.63
23.9 %
Adjusted net realized (gains) losses and other,
net of tax
296
(480)
NM
0.75
(1.18)
NM
Integration expenses and severance, net of tax
13
2
NM
0.03
–
NM
Market risk benefits (gains) losses, net of tax
(16)
93
NM
(0.04)
0.23
NM
Amortization of deferred tax asset from Bermuda law
64
55
16.4 %
0.16
0.14
14.3 %
Core operating income, net of tax
$5,531
$3,969
39.4 %
$14.07
$9.82
43.3 %
Annualized return on equity (ROE)
13.9 %
12.9 %
Core operating return on tangible equity (ROTE)
20.9 %
16.9 %
Core operating ROE
14.3 %
11.2 %
For the six months ended June 30, 2026 and 2025, the tax expenses (benefits) related to the table above were $3 million and $55 million, respectively for adjusted net realized gains and losses and other; $(4) million and nil for integration expenses and severance; $3 million and $(16) million for market risk benefits gains and losses, and $1.32 billion and $937 million for core operating income.
Evan G. Greenberg, Chairman and Chief Executive Officer of Chubb Limited, commented: “We had a very strong quarter with results that again reflect the strengths of our company, including our sources of income, our diversification globally and the growth opportunities it presents, the size and strength of our balance sheet and the growth of our invested asset, and, finally, our disciplined approach to underwriting, which is a hallmark of our culture.
“Strong P&C underwriting, investment and life income led to core operating earnings of $2.8 billion, or $7.26 per share, up 14.6% and 18.2%, respectively, over the prior year. Our most important measure of value creation, tangible book value per share, increased 17.1% from last year.
“P&C underwriting income was more than $1.9 billion, up almost 19%, with a combined ratio of 83.8% – a standout result – and on a current accident year basis excluding CATs, the combined ratio was 82.2%. On the investment side of our business, adjusted net investment income was a record $1.88 billion, up more than 11%, supported by excellent performance in our fixed income and alternative asset portfolios. Our invested asset now stands at $175 billion, up 9% over the last 12 months. Life income grew 9% to $332 million, with good revenue growth in our Asia Life and North America Worksite businesses.
“In terms of P&C markets, overly soft underwriting conditions persist in certain areas of property insurance globally, particularly large account and E&S related. Our revenue results reflect our underwriting discipline, and we will not underwrite knowingly at a loss. The growth penalty we are paying in property will dissipate going forward. In the meantime, soft market conditions are spreading to certain areas of casualty while financial lines also remain soft. Against that backdrop, we’re well diversified and the substantial majority of our businesses are growing, and that is evident in our results.
“P&C premiums rose 3% from last year, or 6.3% excluding large account and E&S property. Overseas General grew 10.2%, with Latin America up 15.6%, Asia up 12% and Europe up 5.1%. North America was up about 0.5%, with commercial down 2.3%, while personal lines and agriculture each grew 6%. Commercial was up 4.1% excluding major and specialty property. In our international life insurance business, premiums and deposits rose 14.4%.
“We are an all-weather company. As long-term compounders of wealth in a cyclical business, we are patient and have many sources of opportunity on both the liability and asset sides of the balance sheet. CATs and FX aside, we are confident in our ability to continue to outperform and generate strong growth in operating earnings and EPS, and double-digit growth in tangible book value.”
Operating highlights for the quarter ended June 30, 2026 were as follows:
Chubb Limited
Q2
Q2
(in millions of U.S. dollars except for percentages)
2026
2025
Change
Consolidated
Net premiums written (increase of 2.0% in constant dollars)
$
14,705
$
14,196
3.6 %
P&C
Net premiums written (increase of 1.4% in constant dollars)
(increase of 6.3% excluding large account and E&S property)
$
12,768
$
12,394
3.0 %
Underwriting income
$
1,937
$
1,631
18.8 %
Combined ratio
83.8 %
85.6 %
Current accident year underwriting income excluding catastrophe losses
$
2,129
$
2,012
5.8 %
Current accident year combined ratio excluding catastrophe losses
82.2 %
82.3 %
Global P&C (excludes Agriculture)
Net premiums written (increase of 1.1% in constant dollars)
$
11,992
$
11,661
2.8 %
Underwriting income
$
1,871
$
1,566
19.5 %
Combined ratio
83.5 %
85.4 %
Current accident year underwriting income excluding catastrophe losses
$
2,049
$
1,946
5.4 %
Current accident year combined ratio excluding catastrophe losses
81.9 %
81.9 %
Life Insurance
Net premiums written (increase of 6.3% in constant dollars)
$
1,937
$
1,802
7.5 %
Segment income (increase of 9.1% in constant dollars)
$
332
$
305
9.0 %
Consolidated net premiums earned increased 5.8%, or 4.0% in constant dollars. P&C net premiums earned increased 5.5%, or 3.6% in constant dollars.
Operating cash flow was $3.73 billion and adjusted operating cash flow was $3.48 billion.
Total capital returned to shareholders in the quarter was $1.37 billion, comprising share repurchases of $979 million at an average purchase price of $327.18 per share and dividends of $395 million. Total capital returned to shareholders for the six months was $2.90 billion, comprising share repurchases of $2.12 billion at an average purchase price of $326.03 per share and dividends of $775 million.
Details of financial results by business segment are available in the Chubb Limited Financial Supplement. Key segment items for the quarter ended June 30, 2026 are presented below:
Chubb Limited
Q2
Q2
(in millions of U.S. dollars except for percentages)
2026
2025
Change
Total North America P&C Insurance
(Comprising NA Commercial P&C Insurance, NA Personal P&C Insurance and NA Agricultural Insurance)
Net premiums written
$
8,424
$
8,394
0.4 %
Combined ratio
81.5 %
81.7 %
Current accident year combined ratio excluding catastrophe losses
79.4 %
79.7 %
North America Commercial P&C Insurance
Net premiums written (increase of 4.1% excluding large account and E&Sproperty)
$
5,594
$
5,723
(2.3) %
Major accounts retail and excess and surplus (E&S) wholesale (increaseof 0.4% excluding large account and E&S property)
$
3,257
$
3,578
(9.0) %
Middle market and small commercial
$
2,337
$
2,145
8.9 %
Combined ratio
85.4 %
83.5 %
Current accident year combined ratio excluding catastrophe losses
81.8 %
81.1 %
North America Personal P&C Insurance
Net premiums written
$
2,054
$
1,938
6.0 %
Combined ratio
67.3 %
73.5 %
Current accident year combined ratio excluding catastrophe losses
69.9 %
72.2 %
North America Agricultural Insurance
Net premiums written
$
776
$
733
6.0 %
Combined ratio
89.7 %
89.1 %
Current accident year combined ratio excluding catastrophe losses
87.6 %
88.8 %
Overseas General Insurance
Net premiums written (increase of 4.8% in constant dollars)
$
3,990
$
3,620
10.2 %
Commercial P&C
$
2,259
$
2,077
8.8 %
Consumer P&C
$
1,731
$
1,543
12.1 %
Combined ratio
82.2 %
90.3 %
Current accident year combined ratio excluding catastrophe losses
85.2 %
85.4 %
Global Reinsurance
Net premiums written
$
354
$
380
(6.7) %
Combined ratio
76.1 %
71.0 %
Current accident year combined ratio excluding catastrophe losses
76.9 %
73.5 %
Life Insurance
Net premiums written (increase of 6.3% in constant dollars)
$
1,937
$
1,802
7.5 %
Net premiums written and deposits (increase of 12.9% in constant dollars)
$
2,652
$
2,320
14.4 %
Segment income (increase of 9.1% in constant dollars)
$
332
$
305
9.0 %
North America Commercial P&C Insurance: The combined ratio increased 1.9 percentage points, including a 1.3 percentage point increase from higher catastrophe losses and a 0.5 percentage point increase in the current accident year loss ratio excluding catastrophe losses.
North America Personal P&C Insurance: The combined ratio decreased 6.2 percentage points, including a 2.4 percentage point decrease from higher favorable prior period development, a 1.5 percentage point decrease from lower catastrophe losses, and a 1.5 percentage point decrease in the current accident year loss ratio excluding catastrophe losses.
North America Agricultural Insurance: The combined ratio increased 0.6 percentage points, including a 1.8 percentage point increase from higher catastrophe losses, partially offset by a 0.7 percentage point decrease in the underlying expense ratio, and a 0.5 percentage point decrease in the current accident year loss ratio excluding catastrophe losses.
Overseas General Insurance: The combined ratio decreased 8.1 percentage points, including a 6.5 percentage point decrease from lower catastrophe losses, a 1.4 percentage point decrease from higher favorable prior period development, and a 0.6 percentage point decrease in the current accident year loss ratio excluding catastrophe losses, partially offset by a 0.4 percentage point increase in the underlying expense ratio, due to shift in the mix of business.
Life Insurance: Net premiums written were $1.94 billion, up 7.5%, with International Life of $1.59 billion, up 6.2%, and Chubb Benefits up 14.0%. Life Segment income was $332 million, up 9.0%, primarily reflecting growth in International Life of 13.0%.
All comparisons are with the same period last year unless otherwise specifically stated.Please refer to the Chubb Limited Financial Supplement, dated June 30, 2026, which is posted on Chubb’s investor relations website, investors.chubb.com, in the Financials section for more detailed information on individual segment performance, together with additional disclosure on reinsurance recoverable, loss reserves, investment portfolio, and debt and capital.
Chubb Limited will hold its second quarter earnings conference call on Wednesday, July 22, 2026, at 8:30 a.m. Eastern. The earnings conference call will be available via live webcast at investors.chubb.com or by dialing 877-400-4403 (within the United States) or 332-251-2601 (international), passcode 1641662. Please refer to the Chubb website under Events and Presentations for details. A replay will be available after the call at the same location. To listen to the replay, click here to register and receive dial-in numbers.
In this release, business activity for, and the financial position of, Chubb acquisitions are reported at 100%, as required, except for core operating income, net income, book value, tangible book value, ROE, per share data, and certain other key metrics, which include only Chubb’s ownership interest and exclude the non-controlling interest.
Citigroup Declares Common Stock Dividend and Preferred Dividends
The Board of Directors of Citigroup Inc. has declared a quarterly dividend on Citigroup’s common stock of $0.67 per share, payable on August 28, 2026, to stockholders of record on August 3, 2026.
The Board of Directors of Citigroup Inc. also declared dividends on Citigroup’s preferred stock as follows:
– 6.250% Fixed Rate/Floating Rate Noncumulative Preferred Stock, Series T, payable August 17, 2026, to holders of record on August 7, 2026. Holders of depositary receipts, each representing one-twenty-fifth of a full preferred share, will be paid $31.25 for each receipt held.
– 4.150% Fixed Rate Reset Noncumulative Preferred Stock, Series Y, payable August 17, 2026, to holders of record on August 7, 2026. Holders of depositary receipts, each representing one-twenty-fifth of a full preferred share, will be paid $10.375 for each receipt held.
– 7.375% Fixed Rate Reset Noncumulative Preferred Stock, Series Z, payable August 17, 2026, to holders of record on August 7, 2026. Holders of depositary receipts, each representing one-twenty-fifth of a full preferred share, will be paid $18.4375 for each receipt held.
– 7.625% Fixed Rate Reset Noncumulative Preferred Stock, Series AA, payable August 17, 2026, to holders of record on August 7, 2026. Holders of depositary receipts, each representing one-twenty-fifth of a full preferred share, will be paid $19.0625 for each receipt held.
– 7.200% Fixed Rate Reset Noncumulative Preferred Stock, Series BB, payable August 17, 2026, to holders of record on August 7, 2026. Holders of depositary receipts, each representing one-twenty-fifth of a full preferred share, will be paid $18.00 for each receipt held.
– 7.125% Fixed Rate Reset Noncumulative Preferred Stock, Series CC, payable August 17, 2026, to holders of record on August 7, 2026. Holders of depositary receipts, each representing one-twenty-fifth of a full preferred share, will be paid $17.8125 for each receipt held.
– 7.000% Fixed Rate Reset Noncumulative Preferred Stock, Series DD, payable August 17, 2026, to holders of record on August 7, 2026. Holders of depositary receipts, each representing one-twenty-fifth of a full preferred share, will be paid $17.50 for each receipt held.
– 6.750% Fixed Rate Reset Noncumulative Preferred Stock, Series EE, payable August 17, 2026, to holders of record on August 7, 2026. Holders of depositary receipts, each representing one-twenty-fifth of a full preferred share, will be paid $16.875 for each receipt held.
– 6.950% Fixed Rate Reset Noncumulative Preferred Stock, Series FF, payable August 17, 2026, to holders of record on August 7, 2026. Holders of depositary receipts, each representing one-twenty-fifth of a full preferred share, will be paid $17.375 for each receipt held.
– 6.875% Fixed Rate Reset Noncumulative Preferred Stock, Series GG, payable August 17, 2026, to holders of record on August 7, 2026. Holders of depositary receipts, each representing one-twenty-fifth of a full preferred share, will be paid $17.1875 for each receipt held.
– 6.625% Fixed Rate Reset Noncumulative Preferred Stock, Series HH, payable August 17, 2026, to holders of record on August 7, 2026. Holders of depositary receipts, each representing one-twenty-fifth of a full preferred share, will be paid $16.5625 for each receipt held.
– 6.250% Noncumulative Preferred Stock, Series II, payable August 17, 2026, to holders of record on August 7, 2026. Holders of depositary receipts, each representing one one-thousandth of a full preferred share, will be paid $0.390625 for each receipt held.
– 6.500% Fixed Rate Reset Noncumulative Preferred Stock, Series JJ, payable August 17, 2026, to holders of record on August 7, 2026. Holders of depositary receipts, each representing one-twenty-fifth of a full preferred share, will be paid $16.25 for each receipt held.
Santander adds 12 million customers as underlying profit rises 15% to €7.3 billion in the first half

Revenue rose 6% to €30.8 billion, with strong net interest income (NII) and net fee income growth, driven by more customers and increased volumes across global businesses[2].
Loans and customer funds grew 9% and 11%, respectively, in constant euros, driven by higher customer activity and supported by the incorporation of TSB.
Total costs were down (-2% in constant euros excluding TSB), reflecting efficiency gains from ONE Transformation, which continued to deliver structural operating leverage, supporting revenue growth while reducing cost-to-serve.
As a result, the efficiency ratio improved to 42.8%, 2.9 percentage points better than a year ago
Underlying profit in Q2 reached €3.8 billion, up 17%.
Santander completed the acquisition of TSB on 30 April, strengthening its UK franchise with over four million customers, a high-quality deposit base, a low-risk mortgage portfolio and at least £400 million of expected cost synergies.
With the buybacks against 2025 results and c.50% of the capital generated from the Poland disposal, as well as the expected c.€1.8 billion buyback against H1’26 results, already approved by the ECB, the bank will have delivered c.€9 billion towards its commitment to distribute at least €10 billion through share buybacks for 2025 and 20263.
Santander is on track to meet its 2026 targets, which exclude the impact of M&A: mid-single-digit revenue growth, costs down, both in constant euros; higher profit (vs. €14.1 billion in 2025); and a CET1 ratio of 12.8-13%4.
Underlying business performance
All variations are year-on-year unless otherwise stated.
Banco Santander reported a record underlying profit of €7,328 million in the first half of 2026, up 15%, driven by strong customer activity and the continued execution of ONE Transformation, that is resulting in lower costs. Attributable profit reached €8,973 million, up 31%, including a €1.9 billion net capital gain following the completion of the disposal of Santander Bank Polska in January, partially offset by €250 million of restructuring costs related to the integration of TSB. Underlying results exclude these non-recurring items, providing a consistent view of operating performance.
Santander continued to expand its customer base, adding 12 million customers over the last twelve months to reach 182 million in total, driven by strong commercial momentum across all businesses, together with the addition of more than four million TSB customers following the acquisition, which was completed on 30 April.
We performed strongly in the first half, adding twelve million customers year-on-year. Revenue grew 6% and costs fell, with ONE Transformation driving further improvements in operating leverage and supporting record profits. The successful completion of the TSB acquisition in the UK marks another important milestone in the execution of our strategy. It strengthens our position in one of our core markets, adding scale, high-quality deposits and a low-risk mortgage portfolio, while creating significant opportunities to improve our customer offering and profitability once the integration is complete.
Ana Botín, Banco Santander executive chair
The bank continued to improve profitability and create value for shareholders, achieving an underlying return on tangible equity (RoTE) of 15.6% (+0.7 percentage points), with underlying earnings per share (EPS) up 20%. Tangible net asset value (TNAV) plus cash dividend per share increased 19%, reflecting sustained value creation driven by higher profitability and disciplined capital allocation.
Business volumes remained strong, with loans increasing 9% and customer funds (deposits + mutual funds) 11% in constant euros, supported by solid commercial momentum across global businesses and the incorporation of TSB. Excluding TSB, loans increased 5% and customer funds 7% (deposits +5%) in constant euros. Loan growth was driven by mortgages in Retail, auto lending in Openbank and double-digit loan growth in CIB.
Total revenue increased 6% to €30,847 million, supported by net interest income of €22,711 million (+7%) and net fee income of €6,851 million (+9%), reflecting higher customer activity, deeper customer relationships and business volume growth across all global businesses. More than 95% of group revenue continues to be linked to customer activity, providing resilience in the current interest rate environment.
Total costs were down (-2% in constant euros excluding TSB), reflecting continued efficiency gains from ONE Transformation, which more than offset inflationary pressures and investments to support business growth. As a result, net operating income increased 12% to €17,636 million, while the efficiency ratio improved by 2.9 percentage points to 42.8%, supported by structurally lower costs and higher revenue.
The group also continued to accelerate the deployment of AI across its businesses, generating €84 million of business value (higher revenue, lower costs and lower loan-loss provisions) in the first half through improved customer service, higher productivity and commercial growth.
Loan-loss provisions increased 9%, mainly reflecting broader market trends in Argentina; excluding this impact, provisions were broadly stable. Credit quality remained solid, with cost of risk at 1.15%, supported by prudent risk management, diversified exposure and historically low unemployment levels across most of the bank’s markets. The non-performing loan ratio improved to 2.93% versus the previous quarter (-7 basis points), remaining at historically low levels, with a coverage ratio of 64%.
The CET1 capital ratio reached 14.0%. Excluding the -55 basis point impact from the TSB acquisition completed on 30 April, the group generated 20 basis points of capital in the quarter through strong organic capital generation. Taking into account the expected impact of the Webster acquisition, Santander remains well positioned to meet its year-end CET1 target between 12.8% and 13%, at the high end of its 12-13% operating range.
Santander continued to deliver attractive shareholder returns, with TNAV plus cash dividend per share up 19%. During the first half, the bank completed the payment of the 2025 cash dividend of 24 euro cents per share, up 14% year-on-year, and continued executing the €5.0 billion share buyback programme announced in February, including the additional distribution linked to the Poland disposal.
Including the share buyback programme currently underway and the expected c.€1.8 billion share buyback programme against H1 2026 earnings, Santander will have delivered c.€9 billion towards its plan to distribute at least €10 billion through share buybacks for 2025 and 2026[3]. The implementation of the programme against H1 2026 results, which has already been approved by the ECB, is subject to the corresponding corporate approvals and its terms will be communicated in due course following approval.
Outlook
Santander reiterates all its 2026 targets, which exclude the impact of M&A in 2025 and 2026. These targets include mid-single-digit revenue growth and lower costs in constant euros, higher profit than the €14.1 billion reported in 2025, and a CET1 ratio between 12.8% and 13%. Revenue growth is expected to continue to be supported by customer activity, with net fee income growing faster than net interest income, while cost discipline and ONE Transformation will continue to drive positive operating leverage.
Santander also reiterates its three-year plan as outlined at its Investor Day last February: by 2028, the group targets a RoTE above 20%, profit above €20 billion and more than 210 million customers[4], supported by scale, network effects and continued improvements in productivity and capital allocation.
Global businesses (H1 2026 vs H1 2025)
To better reflect the performance of each business, the year-on-year changes provided below are presented in constant euros unless stated otherwise. Variations in current euros are available in the financial report.
Retail & Commercial Banking’s underlying profit grew 12% to €4,124 million (+10% excluding TSB), supported by strong commercial momentum, higher fee income, lower costs (-3% or -5% excluding TSB) and efficiency gains from the common operating model. Loans grew by 9% (+2% excluding TSB), with expansion across most segments, mainly driven by higher mortgage lending, while deposits rose by 13% (+6% excluding TSB), reflecting strong customer activity across its footprint. ONE Transformation continues to progress at pace, with product digitalization driving digital sales (+21%) and the customer interaction platform now ready for rollout in Spain. RoTE stood at 17.1%.
Openbank. Digital Consumer Bank was renamed Openbank in the first quarter of 2026, reflecting the integration of Santander’s global consumer finance businesses and its digital bank. Recurrent profit before tax reached €1,651 million, +15%, excluding the UK motor finance provisions, supported by strong growth in both net interest income and fee income. Underlying profit amounted to €827 million, affected by the UK motor finance provisions and the end of electric vehicle tax incentives in the US in 2025. The efficiency ratio and cost of risk stood at 41.6% and 2.09%, respectively. Loans increased 3%, driven by auto lending in Europe and Latin America, while deposits rose 3%, underpinned by continued focus on funding optimization.
CIB reported an underlying profit of €1,742 million (+17%), driven by strong revenue growth (+16%) across all business lines. Global Banking and Global Markets were the main contributors, reflecting the continued success of their growth initiatives. The disciplined execution of the strategy, focused on growing advisory and capital-light businesses, further improved profitability, with RoTE at 20.3%, while the efficiency ratio improved to 40.8%.
Wealth Management & Insurance, which includes the Private Banking and Insurance & Asset Management Solutions businesses, increased its underlying profit by 19% to €1,083 million, with fee income up 11% backed by strong client inflows and focus on value-added activities. Assets under management (AuMs) reached new record levels of €581 billion (+13%), driven by solid commercial activity and market performance. Private Banking customer assets and liabilities (CAL) increased 15%, while Insurance gross written premiums rose 11%.
Payments, which brings together the group’s digital payment capabilities and provides global technology solutions to Santander businesses and third-party clients, generated an underlying profit of €78 million, driven by strong revenue growth as it continued to scale its global platforms and expand its integrated payments ecosystem. Getnet’s total payments volume increased 10%; Getnet Platforms processed 9 billion account-to-account and card transactions in the year, five times more than a year earlier, and Ebury increased its active customers by 28% to over 28,000. The EBITDA margin improved by 3.8 percentage points to 32.6%, reflecting the benefits of greater scale and operating leverage.
Banco Santander is one of the world’s largest banks, with 185,000 employees, serving 182 million customers, 3.5 million shareholders and a market capitalization of €178 billion at the end of June 2026.
[1] Figures are presented on a basis reflecting the changes made to the presentation of the Group’s financial information, effective from the first quarter of 2026 and communicated through Other Relevant Information filed with CNMV on 10 February. Group underlying profit excludes: i) restructuring costs related to TSB in Q2’26 (-€250mn); ii) the capital gain resulting from the disposal of the Poland business in Q1’26 (€1,895mn); and iii) results related to the business subject to the Poland disposal in H1’25 (€456mn). In the Group’s consolidated balance sheet, balances as at 30 June 2026 include TSB, affecting comparisons with prior periods.
[2] All figures are year-on-year unless otherwise stated. Volumes (lending, deposits, etcetera) in constant euros. Reconciliation of underlying results to statutory results, available in the ‘Alternative Performance Measures’ section of the financial report at CNMV and at santander.com.
[3] Total share buybacks as of H1’26 including: i) €1.7bn share buyback against H1’25 results (completed); ii) €1.8bn share buyback against H2’25 results (underway); and iii) €3.2bn additional share buyback to distribute approx. 50% of the CET1 capital generated following the completion of the sale of 49% of Santander Bank Polska to Erste Group on 9 January 2026 (underway). In addition, the ECB has approved a €1.8bn share buyback against H1’26 results. The implementation of the programme against H1’26 results is subject to the corresponding corporate approvals and its terms will be communicated in due course following approval.
[4] Targets market dependent. Based on macro assumptions aligned with international economic institutions. Targets assuming cost of risk stable. 2026 targets are set excluding Poland, TSB and Webster. CET1 ratio targets including all the impacts from inorganic transactions.
QIC’s Digital Ecosystem Named Initiative of the Year in Qatar at the Insurance Asia Awards

Qatar Insurance (QIC), the leading insurer in Qatar and the MENA region, has been awarded the “Digital Insurance Initiative of the Year in Qatar” title at the Insurance Asia Awards 2026.
This accolade recognizes QIC’s success in expanding its digital ecosystem, which stands as the MENA region’s first ecosystem to offer both insurance products and everyday lifestyle services through a single interface.
This year, QIC significantly scaled its ecosystem to cover a wider range of daily needs, incorporating an integrated car marketplace, vehicle care solutions, hotel and event bookings, loyalty rewards and more. Alongside this growth, QIC broadened its network of partners and service providers within its ecosystem, giving customers more choices and experiences tailored to their needs.
Consequently, QIC’s digital ecosystem has emerged as one of the region’s fastest-growing financial services platforms in terms of both user base and service offerings, and now ranks among the highest-rated platforms with an outstanding 4.8 score on both App Store and Google Play.
Commenting on this milestone, Mr. Salem Al Mannai, Group CEO of QIC, stated: “We are honored to have our ecosystem recognized among the best digital initiatives within the Asian insurance sector. This recognition is a strong testament to the success of our strategy and our ongoing efforts to elevate our customers’ experiences by investing in best-in-class digital solutions, and a reaffirmation of QIC’s position as an innovation hub in the region.”
Al Mannai added: “Establishing the MENA region’s first digital ecosystem integrating insurance and lifestyle services is a direct extension of our commitment to the Qatar National Vision 2030 and Qatar Central Bank’s Third Financial Sector Strategic Plan. This commitment continues to drive our ambition to redefine digital services and deliver seamless solutions built on efficiency and convenience.”
Insurance Asia is a Singapore-based magazine specializing in the insurance sector and is widely recognized for its comprehensive coverage of industry news and analysis, as well as exclusive interviews with key decision-makers. Its Insurance Asia Awards are among the continent’s most prestigious industry programs, celebrating companies that have achieved exceptional milestones and driven innovation, setting new benchmarks for excellence across Asia. Winners are selected by an independent judging panel of international experts in digital transformation, financial advisory, and auditing, ensuring transparency and objectivity.
PPA S.A. Receives Double Distinction at the “Protagonists of the Greek Economy 2026” Awards
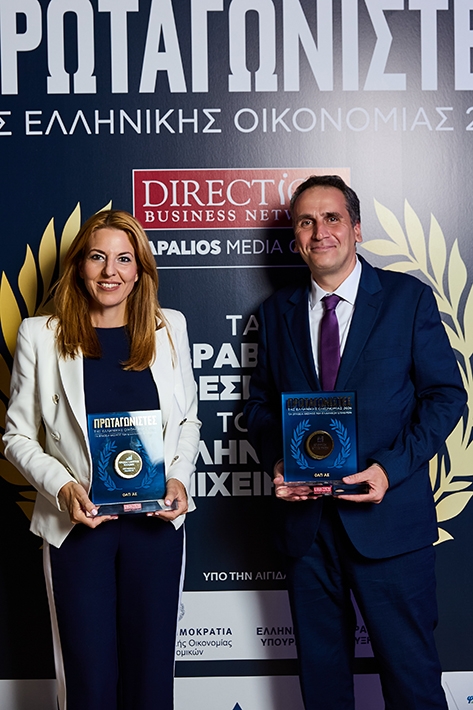
PPA S.A. received two prestigious distinctions at the “Protagonists of the Greek Economy 2026” Awards, reaffirming its leading role in the Greek economy and its longstanding contribution to the country’s growth and development. Specifically, PPA S.A. was named Industry Leader in the Port Authorities category, an award presented to the top-performing companies in key sectors of the Greek economy based on objective financial criteria, including turnover, pre-tax profits and cash reserves. This distinction reflects the Company’s consistent growth trajectory, strong financial performance, and strategic importance to Greece’s port sector and the national economy.
In addition, PPA S.A. received the newly established Historic Enterprise distinction, a category introduced this year to recognize companies with a long-standing and significant contribution to Greek entrepreneurship. This recognition is particularly meaningful as PPA S.A. marks 96 years of continuous operation and development, approaching a century of uninterrupted contribution to Greece’s economic progress, international trade, and maritime industry.
These two distinctions recognize both PPA S.A.’s strong business performance and its remarkable historical legacy, which has established the Company as one of Greece’s leading organizations and a benchmark for the port industry across the wider region.
The awards further underscore PPA S.A.’s enduring commitment to creating long-term value for the Greek economy, its shareholders, employees, and the broader port and maritime community, while continuing to place sustainable development, operational excellence, and innovation at the core of its strategy.
ABN AMRO named Best retail bank in the Netherlands by Euromoney
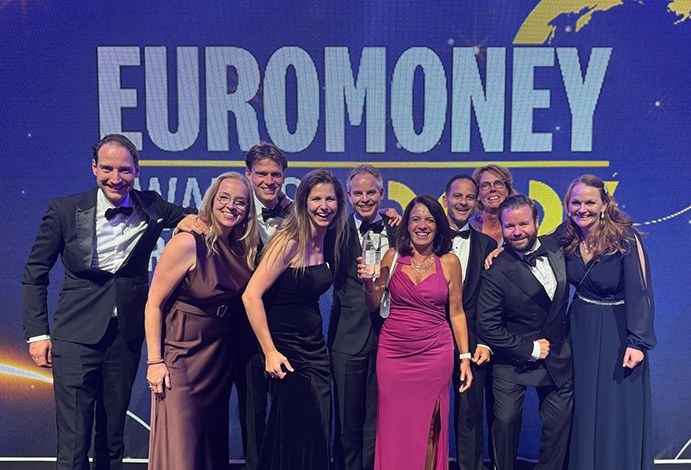
ABN AMRO has been named the Netherlands’ Best Retail Bank by the international financial platform Euromoney. The award was presented during the Euromoney Awards for Excellence 2026 and recognises ABN AMRO’s ongoing efforts to make banking accessible, personal and relevant for millions of clients in the Netherlands, as well as for a younger generation through our new neo-bank BUUT.
According to the jury, ABN AMRO shows how an established bank can continue to innovate successfully by responding to changing client needs and engaging new target groups. The launch of BUUT is a strong example of this. With a social media-style newsfeed, financial education and digital savings pots, BUUT connects with the daily lives and financial needs of a new generation of clients. The jury also praised ABN AMRO’s strong results, including growth in its mortgage portfolio, a larger market share in savings, and the further expansion of its services through, among others, BUX and the planned acquisition of NIBC.
Annerie Vreugdenhil, Chief Commercial Officer Personal & Business Banking:
“This recognition shows that banking is about more than products and technology. In the end, it is about trust: understanding what clients need at important moments in their lives and continuously improving our services so they meet expectations at every age and life stage, while also keeping pace with developments in society. We are grateful to our clients for the trust they place in us.”
Danske Bank – Interim report for the first half of 2026
On July 17, 2026, the Danske Bank Group released the financial results for the first half of 2026.Net profit of DKK 11.9 billion and return on equity of 13.9%.
Download the interim report for the first half of 2026
Lloyds Banking Group recognised as Euromoney’s UK Best Bank for 2026
Lloyds Banking Group has been recognised as the United Kingdom’s Best Bank in the Euromoney Awards for Excellence 2026.The award recognises the progress being made to support 28 million customers across the UK through a combination of strong customer propositions, digital innovation and a focus on helping people and businesses achieve better financial outcomes.As the UK’s largest digital bank, Lloyds Banking Group is investing in the technology, products and services that help customers manage their money with confidence. This includes tools such as Your Credit Score and Benefits Calculator, alongside expanded access to savings, investments and pensions, helping customers navigate key life moments from buying a first home to planning for retirement.The recognition also reflects the Group’s ambition to embed financial empowerment across every stage of the customer journey. By combining data, digital capabilities and AI with the expertise of colleagues, the Group continues to make everyday banking simpler, more personalised and more accessible, supporting households, businesses and communities across the UK.
This is a brilliant moment for everyone across the Group. Being named the UK’s Best Bank recognises the huge progress our teams are making together. It reflects what our colleagues do best: making banking simpler, faster, and more personal for the customers, businesses, and communities we serve, and helping millions of people feel more in control of their finances.
Jasjyot Singh OBECEO, Consumer Relationships
Aon: Second-Quarter 2026 Earnings Release and Conference Call Date
AON plans to announce second-quarter 2026 results on Wednesday, July 29, 2026, in a news release to be issued at 6:30 AM ET.
Aon’s President and CEO Greg Case and CFO Edmund Reese will also host a conference call at 8:30 AM ET on Wednesday, July 29, 2026, which will be broadcast live through Aon’s Investor Relations website at ir.aon.com Opens in a new tab. A replay will be available shortly after the live webcast. The earnings release and supplemental slide presentation will also be available on Aon’s Investor Relations website.
Willis appoints Lars Sorensen as Life Sciences Industry Leader for North America

Willis, a WTW business, announced the appointment of Lars Sorensen as Life Sciences Industry Leader for North America.
Sorensen will lead Willis’ life sciences industry strategy and work with leaders and placement teams to advance Willis’ position as a trusted advisor in the life sciences sector. He will report to Mike Giacobbe, Chief Commercial Officer, Willis North America. Sorensen will also drive solution development and serve as a subject matter expert for clients.
“Lars’ deep life sciences expertise, global perspective and client focus will strengthen our ability to help clients navigate complex business challenges, address emerging risks and achieve their objectives,” said Mike Giacobbe, Chief Commercial Officer, Willis North America. “His appointment reflects our continued investment in specialty talent and our commitment to delivering differentiated advice and solutions to clients.”
Sorensen brings more than 30 years of experience to Willis, most recently serving as Life Sciences Industry Vertical Leader, EMEA/UK at Aon. He has built and led high-performing teams, developed long-standing client relationships and driven growth across multiple markets, with expertise spanning industry, broking and liability.